

Identification of a PTEN mutation with reduced protein stability, phosphatase activity, and nuclear localization in Hong Kong patients with autistic features, neurodevelopmental delays, and macrocephaly
- PMID: 29608813
- PMCID: PMC6220804
- DOI: 10.1002/aur.1950
Identification of a PTEN mutation with reduced protein stability, phosphatase activity, and nuclear localization in Hong Kong patients with autistic features, neurodevelopmental delays, and macrocephaly
Abstract
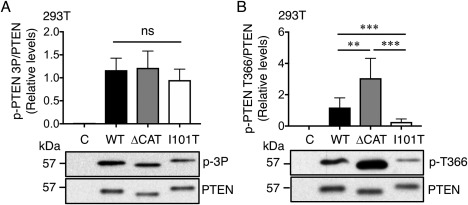
PTEN is a tumor suppressor gene inactivated in over 30% of human cancers. It encodes a lipid phosphatase that serves as a gatekeeper of the phosphoinositide 3-kinase signaling pathway. Germline mutation frequently occurs in this gene in patients diagnosed with PTEN Hamartoma Tumor Syndrome (PHTS). PHTS individuals are characterized by macrocephaly, benign growth of multiple tissues and increased tumor risk. In addition, autistic phenotypes are found in 10-20% of individuals carrying the germline PTEN mutation with macrocephaly. In this report, 13 suspected PHTS patients were screened for mutation in the PTEN gene. A missense variant (c. 302T > C) substituting the isoleucine at codon 101 to a threonine, a single nucleotide insertion (c. 327-328insC) causing a frame shift mutation and termination at codon 109, and a nonsense variant (c. 1003C > T) truncated the protein at codon 335 were identified. The I101T mutation significantly reduced PTEN protein expression levels by 2.5- to 4.0-fold. Mechanistically, I101T reduced the protein half-life of PTEN possibly due to enhanced polyubiquitination at Lysine 13. However, the I101T mutant retained almost 30% of the lipid phosphatase activity of the wild-type protein. Finally, the I101T mutant has reduced phosphorylation at a PTEN auto-dephosphorylation site at Threonine 366 and a lowered ratio of nuclear to cytosolic protein level. These partial losses of multiple PTEN biochemical functions may contribute to the tissue overgrowth and autistic features of this PHTS patient. Autism Res 2018, 11: 1098-1109. © 2018 The Authors Autism Research published by International Society for Autism Research and Wiley Periodicals, Inc. LAY SUMMARY: The genetics of autism spectrum disorders is highly complex with individual risk influenced by both genetic and environmental factors. Mutation in the human PTEN gene confers a high risk of developing autistic behavior. This report revealed that PTEN mutations occurred in 23% of a selected group of Hong Kong patients harboring autistic features with gross overgrowth symptoms. Detailed characterization of a PTEN mutation revealed reduced protein stability as one of the underlying mechanisms responsible for reduced PTEN activity.
Keywords: Hong Kong; PTEN; PTEN hamartoma tumor syndrome; autism spectrum disorders; macrocephaly.
© 2018 The Authors Autism Research published by International Society for Autism Research and Wiley Periodicals, Inc.
Figures


Similar articles
-
Autism-associated PTEN missense mutation leads to enhanced nuclear localization and neurite outgrowth in an induced pluripotent stem cell line.FEBS J. 2020 Nov;287(22):4848-4861. doi: 10.1111/febs.15287. Epub 2020 Mar 26. FEBS J. 2020. PMID: 32150788 Free PMC article.
-
Dynamics and structural stability effects of germline PTEN mutations associated with cancer versus autism phenotypes.J Biomol Struct Dyn. 2019 Apr;37(7):1766-1782. doi: 10.1080/07391102.2018.1465854. Epub 2018 May 14. J Biomol Struct Dyn. 2019. PMID: 29663862 Free PMC article.
-
Prevalence and clinical/molecular characteristics of PTEN mutations in Turkish children with autism spectrum disorders and macrocephaly.Mol Genet Genomic Med. 2021 Aug;9(8):e1739. doi: 10.1002/mgg3.1739. Epub 2021 Jul 16. Mol Genet Genomic Med. 2021. PMID: 34268892 Free PMC article.
-
Imaging of PTEN-related abnormalities in the central nervous system.Clin Imaging. 2020 Apr;60(2):180-185. doi: 10.1016/j.clinimag.2019.12.006. Epub 2019 Dec 24. Clin Imaging. 2020. PMID: 31927175 Review.
-
Balancing Proliferation and Connectivity in PTEN-associated Autism Spectrum Disorder.Neurotherapeutics. 2015 Jul;12(3):609-19. doi: 10.1007/s13311-015-0356-8. Neurotherapeutics. 2015. PMID: 25916396 Free PMC article. Review.
Cited by
-
Nuclear PTEN's Functions in Suppressing Tumorigenesis: Implications for Rare Cancers.Biomolecules. 2023 Jan 30;13(2):259. doi: 10.3390/biom13020259. Biomolecules. 2023. PMID: 36830628 Free PMC article. Review.
-
Behavioural and psychological features of PTEN mutations: a systematic review of the literature and meta-analysis of the prevalence of autism spectrum disorder characteristics.J Neurodev Disord. 2022 Jan 4;14(1):1. doi: 10.1186/s11689-021-09406-w. J Neurodev Disord. 2022. PMID: 34983360 Free PMC article.
-
The mTOR pathway genes mTOR, Rheb, Depdc5, Pten, and Tsc1 have convergent and divergent impacts on cortical neuron development and function.bioRxiv [Preprint]. 2024 Jan 6:2023.08.11.553034. doi: 10.1101/2023.08.11.553034. bioRxiv. 2024. Update in: Elife. 2024 Feb 27;12:RP91010. doi: 10.7554/eLife.91010. PMID: 37609221 Free PMC article. Updated. Preprint.
-
The impact of phosphorylated PTEN at threonine 366 on cortical connectivity and behaviour.Brain. 2022 Oct 21;145(10):3608-3621. doi: 10.1093/brain/awac188. Brain. 2022. PMID: 35603900 Free PMC article.
-
PTEN mutations impair CSF dynamics and cortical networks by dysregulating periventricular neural progenitors.Nat Neurosci. 2025 Mar;28(3):536-557. doi: 10.1038/s41593-024-01865-3. Epub 2025 Feb 24. Nat Neurosci. 2025. PMID: 39994410
References
-
- Butler, M.G. , Dasouki, M.J. , Zhou, X.P. , Talebizadeh, Z. , Brown, M. , Takahashi, T.N. , … Eng, C. (2005). Subset of individuals with autism spectrum disorders and extreme macrocephaly associated with germline PTEN tumour suppressor gene mutations. Journal of Medical Genetics, 42, 318–321. - PMC - PubMed
-
- Christensen, D.L. , Baio, J. , Van Naarden Braun, K. , Bilder, D. , Charles, J. , Constantino, J.N. , … Yeargin‐Allsopp, M. (2016). Prevalence and characteristics of autism spectrum disorder among children aged 8 years–autism and developmental disabilities monitoring network, 11 sites, United States, 2012. MMWR Surveillance Summaries, 65, 1–23. - PMC - PubMed
-
- Duerr, E.M. , Rollbrocker, B. , Hayashi, Y. , Peters, N. , Meyer‐Puttlitz, B. , Louis, D.N. , … von Deimling, A. (1998). PTEN mutations in gliomas and glioneuronal tumors. Oncogene, 16, 2259–2264. - PubMed
-
- Fragoso, R. , & Barata, J.T. (2015). Kinases, tails and more: Regulation of PTEN function by phosphorylation. Methods, 77–78, 75–81. - PubMed
Publication types
MeSH terms
Substances
Grants and funding
LinkOut - more resources
Full Text Sources
Other Literature Sources
Medical
Molecular Biology Databases
Research Materials
