

Spatio-temporal dynamic of malaria in Ouagadougou, Burkina Faso, 2011-2015
- PMID: 29609606
- PMCID: PMC5879937
- DOI: 10.1186/s12936-018-2280-y
Spatio-temporal dynamic of malaria in Ouagadougou, Burkina Faso, 2011-2015
Abstract
Background: Given the scarcity of resources in developing countries, malaria treatment requires new strategies that target specific populations, time periods and geographical areas. While the spatial pattern of malaria transmission is known to vary depending on local conditions, its temporal evolution has yet to be evaluated. The aim of this study was to determine the spatio-temporal dynamic of malaria in the central region of Burkina Faso, taking into account meteorological factors.
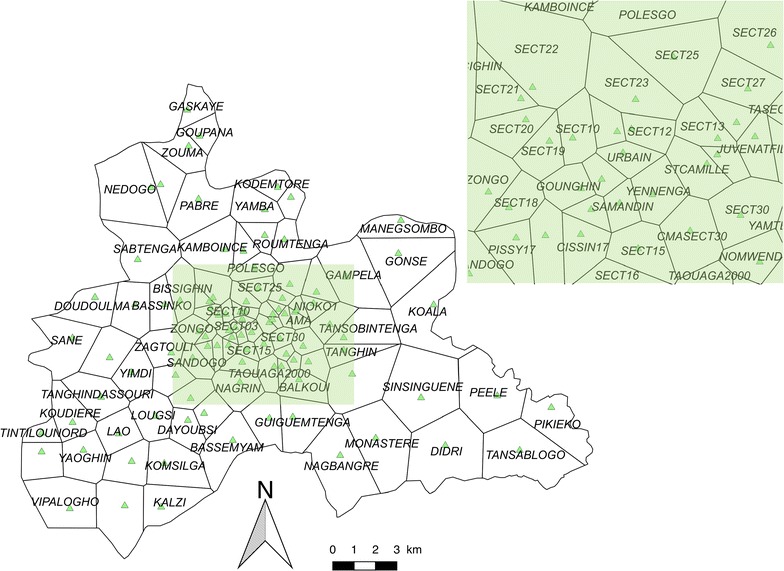
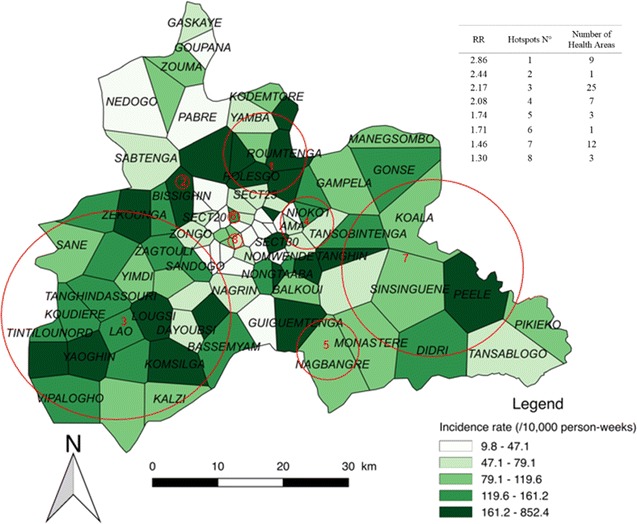
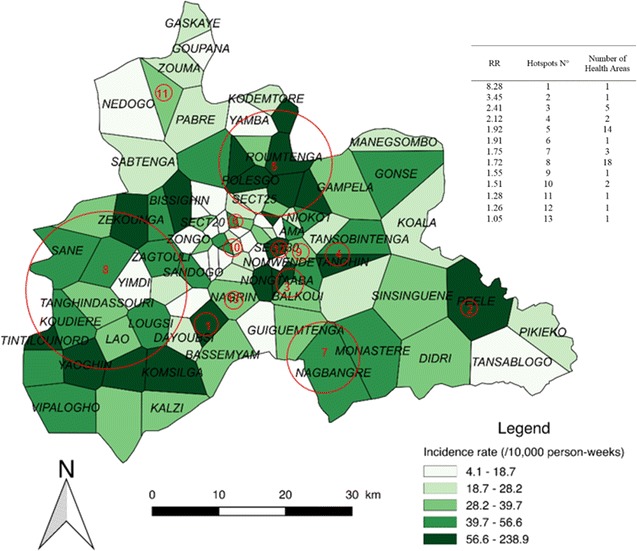
Methods: Drawing on national databases, 101 health areas were studied from 2011 to 2015, together with weekly meteorological data (temperature, number of rain events, rainfall, humidity, wind speed). Meteorological factors were investigated using a principal component analysis (PCA) to reduce dimensions and avoid collinearities. The Box-Jenkins ARIMA model was used to test the stationarity of the time series. The impact of meteorological factors on malaria incidence was measured with a general additive model. A change-point analysis was performed to detect malaria transmission periods. For each transmission period, malaria incidence was mapped and hotspots were identified using spatial cluster detection.
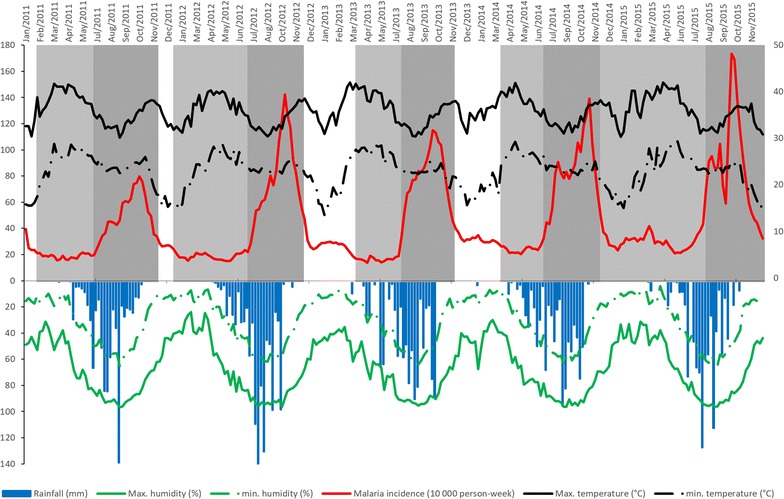
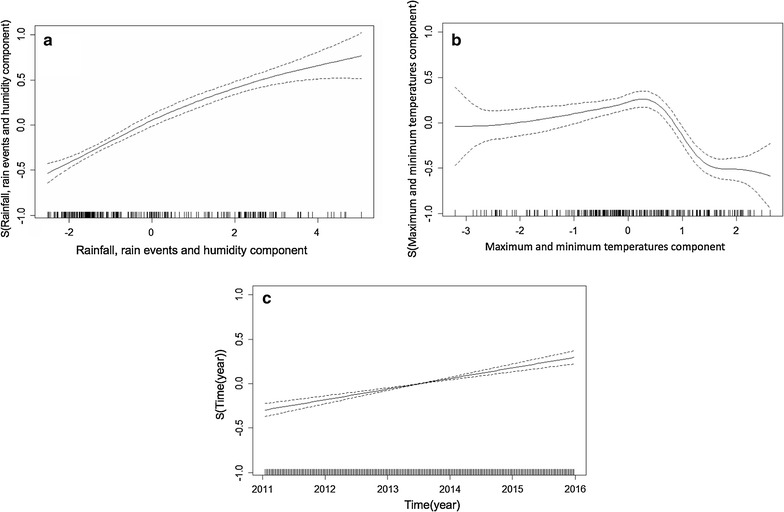
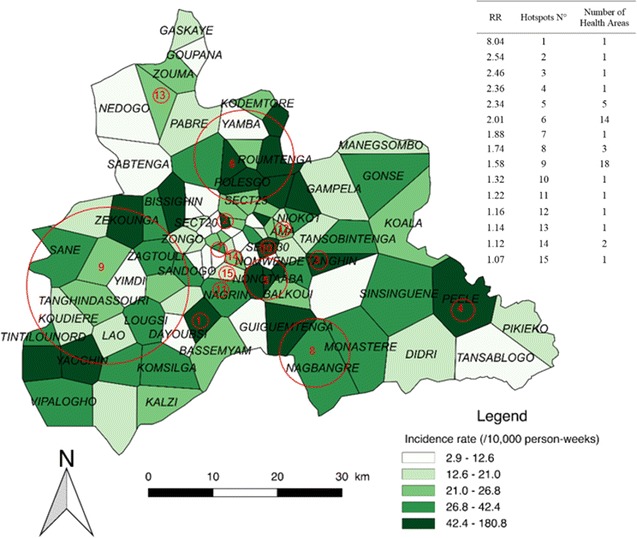
Results: Malaria incidence never went below 13.7 cases/10,000 person-weeks. The first and second PCA components (constituted by rain/humidity and temperatures, respectively) were correlated with malaria incidence with a lag of 2 weeks. The impact of temperature was significantly non-linear: malaria incidence increased with temperature but declined sharply with high temperature. A significant positive linear trend was found for the entire time period. Three transmission periods were detected: low (16.8-29.9 cases/10,000 person-weeks), high (51.7-84.8 cases/10,000 person-weeks), and intermediate (26.7-32.2 cases/10,000 person-weeks). The location of clusters identified as high risk varied little across transmission periods.
Conclusion: This study highlighted the spatial variability and relative temporal stability of malaria incidence around the capital Ouagadougou, in the central region of Burkina Faso. Despite increasing efforts in fighting the disease, malaria incidence remained high and increased over the period of study. Hotspots, particularly those detected for low transmission periods, should be investigated further to uncover the local environmental and behavioural factors of transmission, and hence to allow for the development of better targeted control strategies.
Keywords: Hotspots; Malaria; Spatial clusters; Spatio-temporal dynamic.
Figures
References
-
- Ministère de la santé. Annuaire statistique 2015. Direction générale des études et des statistiques sectorielles. 2016. http://www.sante.gov.bf/index.php?option=com_edocman&view=document&id=11.... Accessed 10 Jan 2017.
-
- WHO. Global Malaria Programme. Global technical strategy for malaria, 2016–2030. Geneva: World Health Organization; 2015. http://www.who.int/malaria/publications/atoz/9789241564991/en/. Accessed 8 Feb 2017.
-
- Yukich J, Bennett A, Yukich R, Stuck L, Hamainza B, Silumbe K, et al. Estimation of malaria parasite reservoir coverage using reactive case detection and active community fever screening from census data with rapid diagnostic tests in southern Zambia: a re-sampling approach. Malar J. 2017;16:137. doi: 10.1186/s12936-017-1782-3. - DOI - PMC - PubMed
-
- Bousema T, Stresman G, Baidjoe AY, Bradley J, Knight P, Stone W, et al. The impact of hotspot-targeted interventions on malaria transmission in Rachuonyo South District in the western Kenyan highlands: a cluster-randomized controlled trial. PLoS Med. 2016;13:e1001993. doi: 10.1371/journal.pmed.1001993. - DOI - PMC - PubMed
MeSH terms
Grants and funding
LinkOut - more resources
Full Text Sources
Other Literature Sources
Medical
