. 2018 Apr 3;16(1):34.
doi: 10.1186/s12915-018-0503-x.

The integrated stress response regulates BMP signalling through effects on translation

Affiliations

The integrated stress response regulates BMP signalling through effects on translation

Elke Malzer et al. BMC Biol. .

Abstract

Background: Developmental pathways must be responsive to the environment. Phosphorylation of eIF2α enables a family of stress-sensing kinases to trigger the integrated stress response (ISR), which has pro-survival and developmental consequences. Bone morphogenetic proteins (BMPs) regulate multiple developmental processes in organisms from insects to mammals.

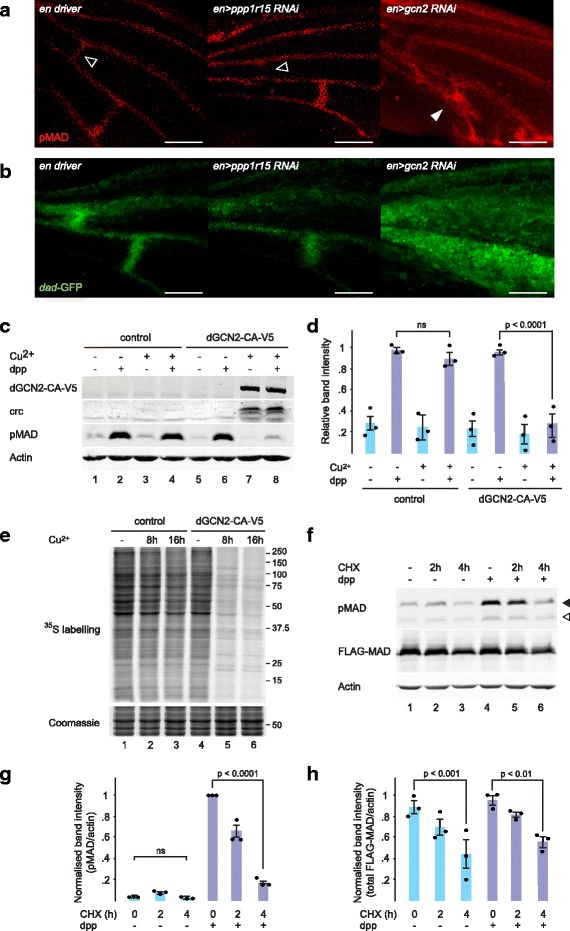
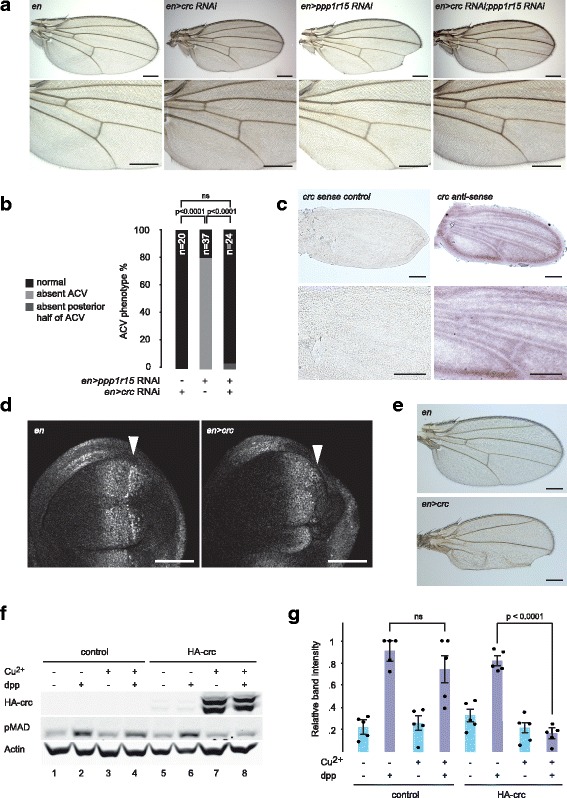
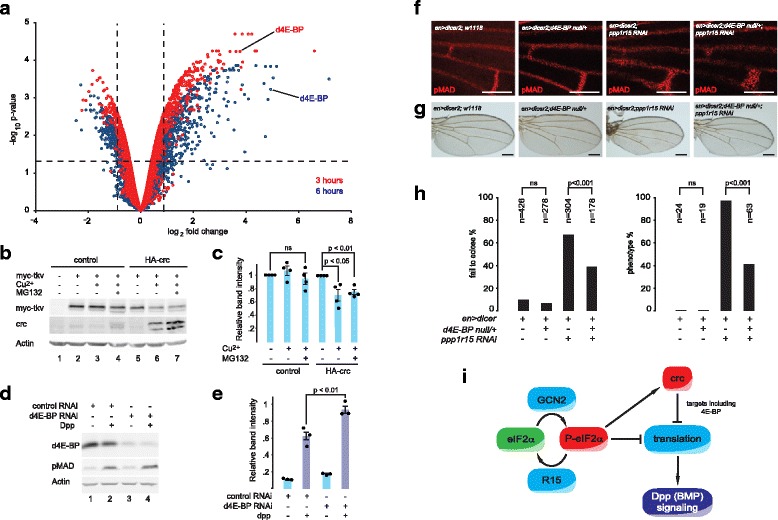
Results: Here we show in Drosophila that GCN2 antagonises BMP signalling through direct effects on translation and indirectly via the transcription factor crc (dATF4). Expression of a constitutively active GCN2 or loss of the eIF2α phosphatase dPPP1R15 impairs developmental BMP signalling in flies. In cells, inhibition of translation by GCN2 blocks downstream BMP signalling. Moreover, loss of d4E-BP, a target of crc, augments BMP signalling in vitro and rescues tissue development in vivo.

Conclusion: These results identify a novel mechanism by which the ISR modulates BMP signalling during development.

Keywords: 4E-BP; ATF4; BMP; GCN2; PPP1R15; Translation.


Conflict of interest statement

Ethics approval

Ethics approval is not required for Drosophila experimentation in the UK.

Consent for publication

No person’s data were used in this study.

Competing interests

The authors declare that they have no competing interests.

Publisher’s Note

Springer Nature remains neutral with regard to jurisdictional claims in published maps and institutional affiliations.

Figures

Fig. 1
Fig. 1
Depletion of dPPP1R15 or dGCN2 alters wing venation. a Representative photomicrographs (5× objective) of adult wings of the indicated genotypes. Lower panels are enlargements of the crossvein territories: anterior crossvein (ACV) (open arrowhead) and posterior crossvein (PCV). Note extra venation (closed arrowheads) in wings expressing gcn2 RNAi. Scale bars = 250 μm. b Quantification of ACV phenotypes. For brevity, enGAL4 > UAS-ppp1r15 RNAi is indicated as en > ppp1r15 RNAi. enGAL4 > UAS-gcn2 RNAi is indicated as en > gcn2 RNAi. n denotes number of animals counted. P values calculated using X2 statistics with Bonferroni correction for multiple comparisons. c Representative photomicrographs of adult wings (5× objective) of the indicated genotypes. en > dicer2 indicates enGAL4 > UAS-dicer2. en > dicer2;ppp1r15 RNAi indicates enGAL4 > UAS-dicer2;ppp1r15 RNAi. Lower panels are enlargements of the crossvein territories. Scale bars = 250 μm. d, e Representative photomicrographs of adult wings (5× objective) of the indicated genotypes. nab > gcn2 RNAi indicates enGAL4 > UAS-gcn2 RNAi. dppd5/+; nab > gcn2 RNAi indicates Dppd5/+; nab > UAS-gcn2 RNAi. Lower panels are enlargements of the crossvein territories. Note extra venation (closed arrowheads). f Quantification of wings from d and e. Scale bars = 250 μm. g Representative photomicrographs of adult eyes (dorsal view) of the indicated genotypes; inset shows zoom of eye. Scale bar = 200 μm
Fig. 2
Fig. 2
dPPP1R15 or dGCN2 affects MAD phosphorylation in the developing wing. a Representative fluorescence micrographs of pupal wings of the indicated genotypes at 30 h after pupariation stained red for pMAD. Open arrowheads indicate ACV territory. Closed arrowheads indicate ectopic pMAD signal. Scale bars = 100 μm. b Representative fluorescence micrograph of pupal wings of the indicated genotypes at 30 h after pupariation. Green fluorescence indicates activation of the dad-GFP.N reporter. Scale bars = 100 μm. c Immunoblot of cell lysates: lanes 1–4, S2 cells stably transfected with V5.pMT-Puro; lanes 5–8, S2 cells stably transfected with dGCN2-CA-V5.pMT-Puro. Cu2+ indicates treatment with 0.7 mM copper sulphate for 16 h; dpp indicates treatment with 1 nM Dpp for 1 h prior to lysis. dGCN2-CA-V5 was detected with anti-V5 antibody. crc, pMAD and actin were detected using specific antibodies. d Quantification of pMAD staining in c with strongest signal with each experiment set as 1. n = 3. P value calculated using analysis of variance (ANOVA) with Bonferroni post hoc testing. e S2 cell lysates: lanes 1–3, V5.pMT-Puro S2 cells; lanes 4–6, dGCN2-CA-V5.pMT-Puro S2 cells. Cu2+ indicates treatment with 0.7 mM copper sulphate for the indicated times. 35S-labelled cysteine and methionine were added to cells for 10 min prior to lysis. 35S-labelling indicates autoradiograph. Coomassie staining served as a loading control. f Immunoblot of S2 cell lysates expressing FLAG-MAD. CHX indicates treatment with 14 μg/ml cycloheximide for the indicated times. dpp indicates treatment with 0.5 nM dpp for 1 h prior to lysis. FLAG-MAD was detected with an anti-FLAG antibody. pMAD and actin were detected with specific antibodies. Filled arrowhead indicates phosphorylated MAD-FLAG; open arrowhead indicates endogenous pMAD. g Quantification of phosphorylated FLAG-MAD (pMAD) and (h) total FLAG-MAD from f, both normalised to actin signal with the strongest signal in each experiment set as 1. n = 3. P value calculated using ANOVA with Bonferroni post hoc testing
Fig. 3
Fig. 3
crc regulates wing venation and antagonises MAD phosphorylation. a Representative photomicrographs (5× objective) of adult wings of the indicated genotypes. En indicates enGAL4 driver control. en > crc RNAi indicates enGAL4 > UAS-crc RNAi. en > ppp1r15 RNAi indicates enGAL4 > UAS-ppp1r15 RNAi. en > ppp1r15 RNAi;crc RNAi indicates enGAL4 > UAS-crc RNAi;UAS-ppp1r15 RNAi. Lower panels are enlargements of the crossvein territories. Scale bars = 250 μm. b Quantification of ACV phenotype in a. P values calculated using X2 statistics with Bonferroni correction for multiple comparisons. c In situ hybridisation of w1118 pupal wings with sense or antisense probes to residues 1405–1900 of crc transcript A. Scale bars = 250 μm. d Representative fluorescence micrograph (40× objective) of wing imaginal discs: signal = pMAD. En indicates enGAL4 driver control. en > crc indicates enGAL4 > UAS-HA-crcA. Orientation: left = anterior. Arrowhead indicates expected position of posterior pMAD zone. Scale bars = 50 μm. e Representative photomicrographs of adult wings of the indicated genotypes. En indicates enGAL4 driver control. en > crc indicates enGAL4 > UAS-crc. Scale bars = 250 μm. f Immunoblot of S2 cell lysates: lanes 1–4, S2 cells stably transfected with HA.pMT-Puro; lanes 5–8, S2 cells stably transfected with HA-crcA.pMT-Puro. Cu2+ indicates treatment with 0.7 mM copper sulphate for 24 h. dpp indicates treatment with 0.5 nM dpp for 1 h prior to lysis. HA-crc was detected with anti-HA antibody. pMAD and actin were detected using specific antibodies. g Quantification of pMAD staining in f with highest signal per experiment set as 1. n = 5. P value calculated using analysis of variance (ANOVA) with Bonferroni post hoc testing
Fig. 4
Fig. 4
4E-BP contributes to the inhibition of MAD phosphorylation. a Microarray analysis of transcriptional changes caused by expression of crc in S2 cells. Volcano plot of transcriptional profiles of HA-crcA.pMT-Puro S2 stable cells relative to HA.pMT-Puro S2 stable cells, each treated with 0.7 mM copper sulphate for 3 h (red symbols) or 6 h (blue symbols). Vertical broken lines indicate 2−/+ 0.7-fold change. Horizontal broken line indicates P = 0.05 threshold. d4E-BP is indicated at 3 h (red) and 6 h (blue). b Immunoblot of cell lysates expressing myc-Tkv in the absence or presence of crc. c Quantification of b, samples normalised to no Cu2+ for each cell line. n = 3. P value calculated using ANOVA with Bonferroni post hoc testing. d Immunoblot of S2 cell lysates to assess the effect of d4E-BP small interfering RNA (RNAi) on MAD phosphorylation caused by 0.5 nM Dpp concentrations. e Quantification of d. n = 3. P value calculated using ANOVA with Bonferroni post hoc testing. f Representative fluorescence micrographs of pupal wings of the indicated genotypes at 30 h after pupariation stained red for pMAD. Scale bars = 100 μm. g Representative photomicrographs (5× objective) of adult wings of the indicated genotypes. Scale bars = 200 μm. h Quantification of animals from g. Left graph indicates proportion of animals failing to eclose by 14. Right graph indicates frequency of wing vein phenotype if eclosing adults. P values calculated using X2 statistics with Bonferroni correction for multiple comparisons. i Schematic of interaction between integrated stress response (ISR) and BMP signalling. eIF2α is phosphorylated by GCN2 to P-eIF2α; PPP1R15 (R15) dephosphorylates P-eIF2α. P-eIF2α directly inhibits most cap-dependent translation of mRNAs, but induces expression of crc (Drosophila ATF4). Targets of crc further affect translation, e.g. 4E-BP antagonises translation of some mRNAs. Ongoing translation is necessary for efficient BMP signalling, and so repression of protein synthesis by the ISR inhibits BMP signalling

References

    1. Harding H, Zhang Y, Zeng H, Novoa I, Lu P, Calfon M, Sadri N, Yun C, Popko B, Paules R, et al. An integrated stress response regulates amino acid metabolism and resistance to oxidative stress. Mol Cell. 2003;11:619–633. doi: 10.1016/S1097-2765(03)00105-9. - DOI - PubMed
    1. Vattem KM, Wek RC. Reinitiation involving upstream ORFs regulates ATF4 mRNA translation in mammalian cells. Proc Natl Acad Sci U S A. 2004;101(31):11269–11274. doi: 10.1073/pnas.0400541101. - DOI - PMC - PubMed
    1. Lu PD, Harding HP, Ron D. Translation re-initiation at alternative open reading frames regulates gene expression in an integrated stress response. J Cell Biol. 2004;167(October 11, 2004):27–33. doi: 10.1083/jcb.200408003. - DOI - PMC - PubMed
    1. Novoa I, Zeng H, Harding H, Ron D. Feedback inhibition of the unfolded protein response by GADD34-mediated dephosphorylation of eIF2a. J Cell Biol. 2001;153(5):1011–1022. doi: 10.1083/jcb.153.5.1011. - DOI - PMC - PubMed
    1. Marciniak SJ, Yun CY, Oyadomari S, Novoa I, Zhang Y, Jungreis R, Nagata K, Harding HP, Ron D. CHOP induces death by promoting protein synthesis and oxidation in the stressed endoplasmic reticulum. Genes Dev. 2004;18:3066–3077. doi: 10.1101/gad.1250704. - DOI - PMC - PubMed

Publication types

MeSH terms