. 2018 May 1;200(9):3244-3258.
doi: 10.4049/jimmunol.1701733. Epub 2018 Apr 2.

Mycobacterium tuberculosis Transfer RNA Induces IL-12p70 via Synergistic Activation of Pattern Recognition Receptors within a Cell Network

Affiliations

Mycobacterium tuberculosis Transfer RNA Induces IL-12p70 via Synergistic Activation of Pattern Recognition Receptors within a Cell Network

Caroline Keegan et al. J Immunol. .

Abstract

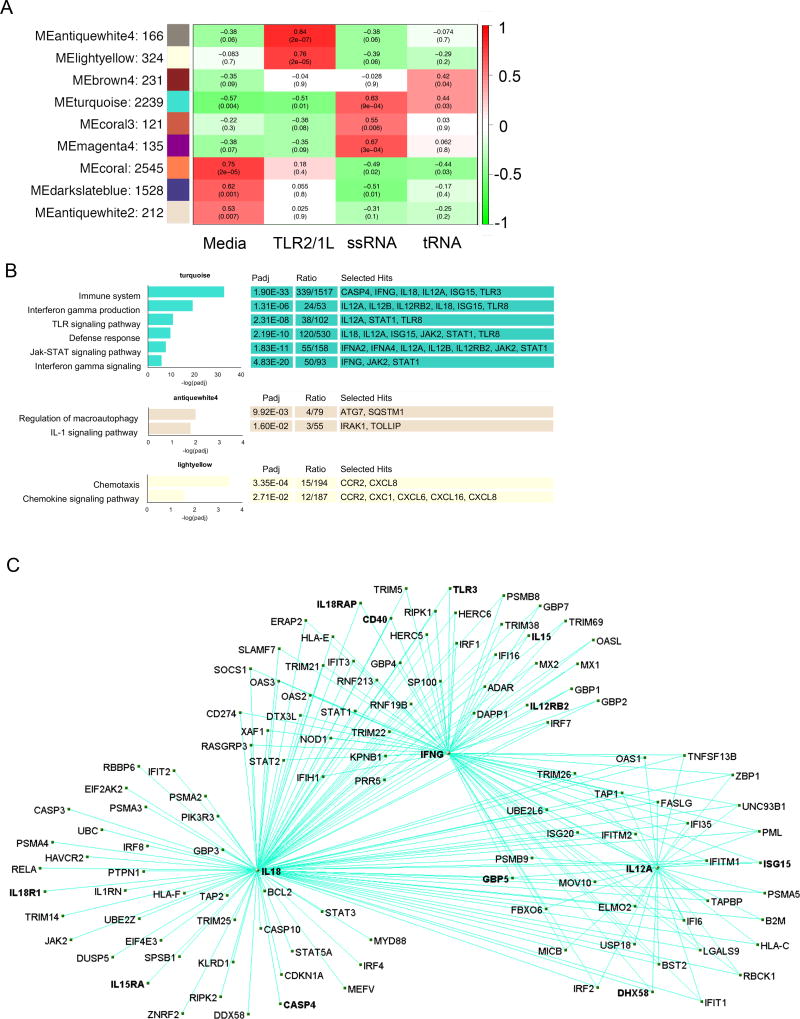
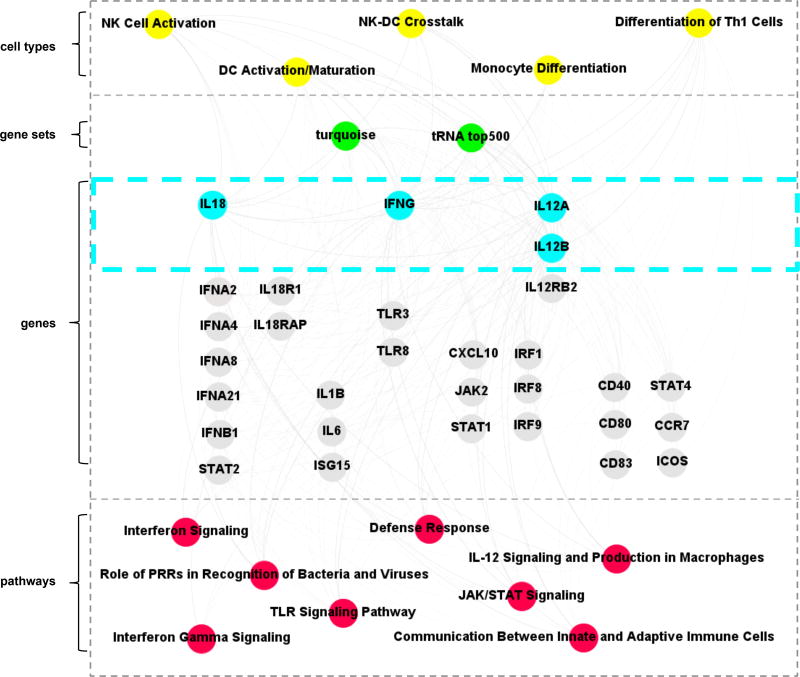
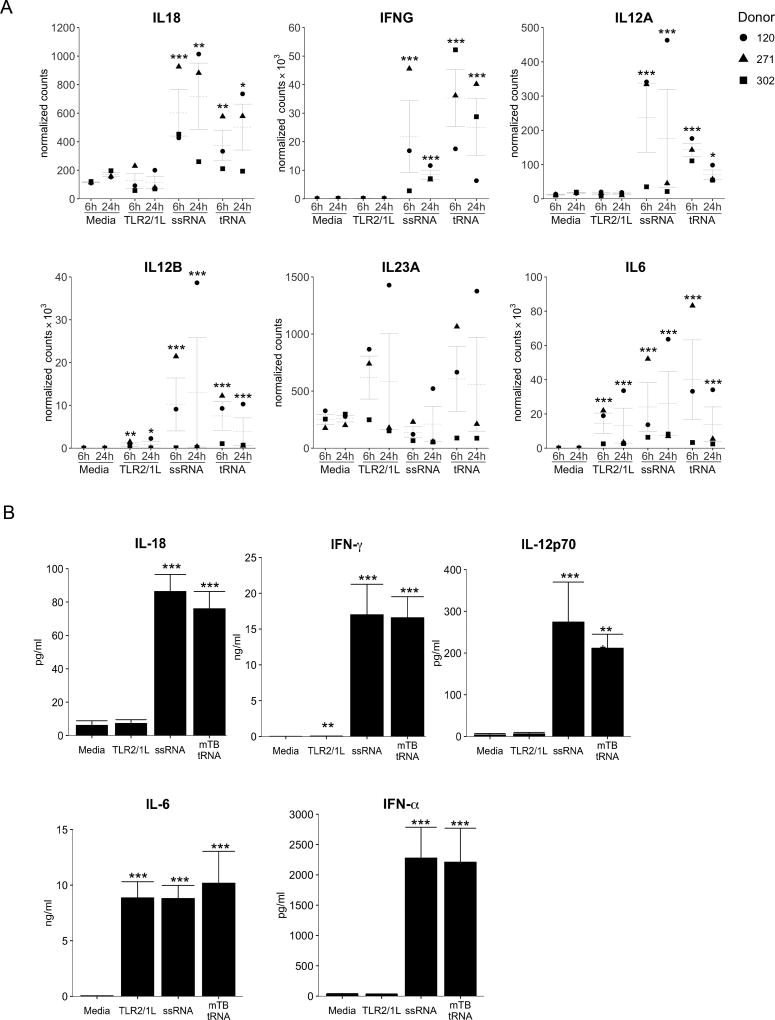
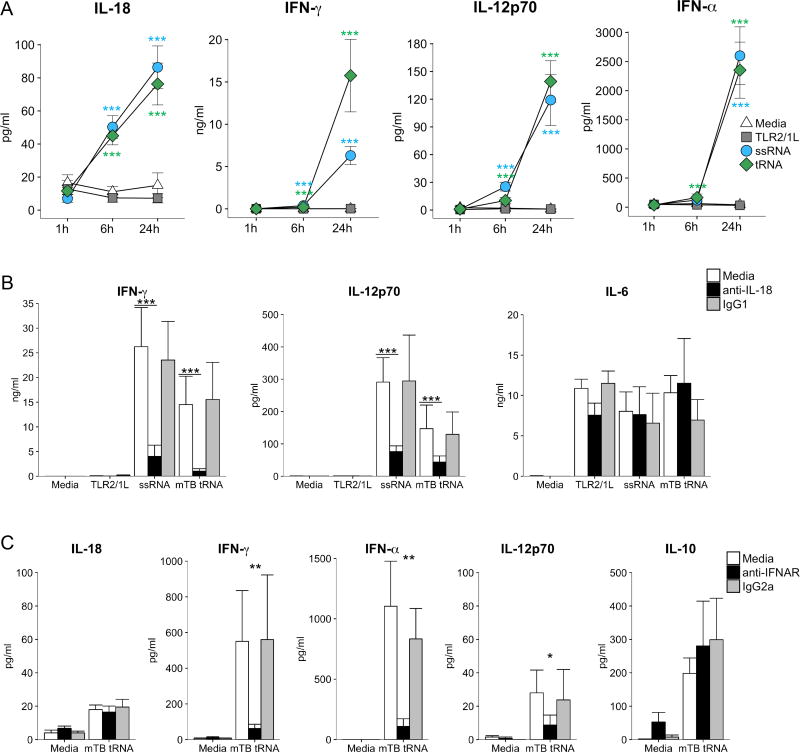
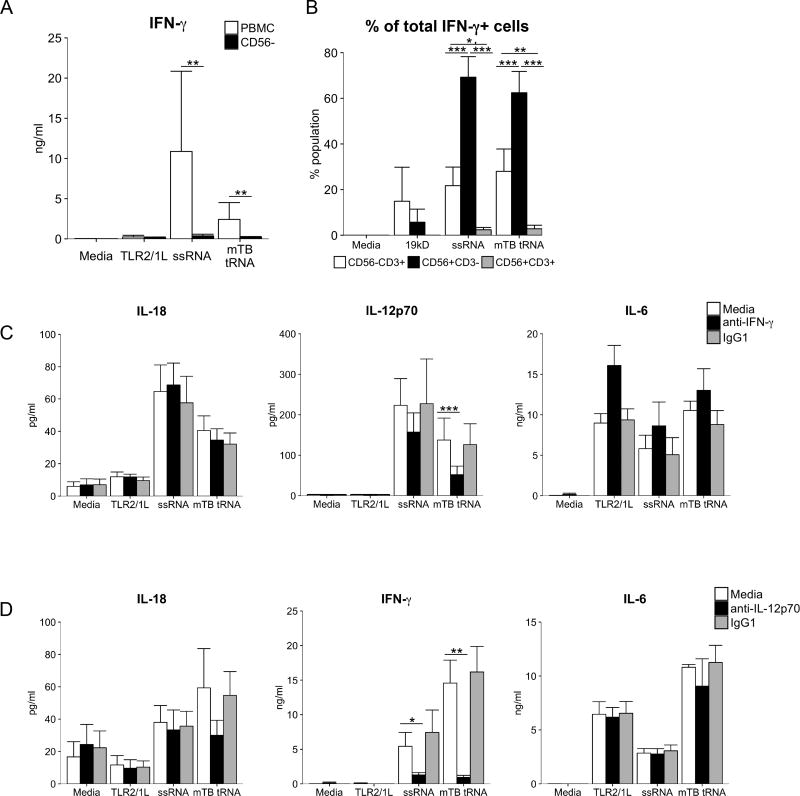
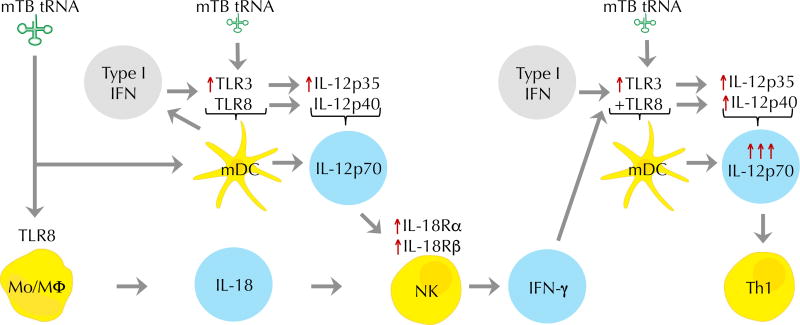
Upon recognition of a microbial pathogen, the innate and adaptive immune systems are linked to generate a cell-mediated immune response against the foreign invader. The culture filtrate of Mycobacterium tuberculosis contains ligands, such as M. tuberculosis tRNA, that activate the innate immune response and secreted Ags recognized by T cells to drive adaptive immune responses. In this study, bioinformatics analysis of gene-expression profiles derived from human PBMCs treated with distinct microbial ligands identified a mycobacterial tRNA-induced innate immune network resulting in the robust production of IL-12p70, a cytokine required to instruct an adaptive Th1 response for host defense against intracellular bacteria. As validated by functional studies, this pathway contained a feed-forward loop, whereby the early production of IL-18, type I IFNs, and IL-12p70 primed NK cells to respond to IL-18 and produce IFN-γ, enhancing further production of IL-12p70. Mechanistically, tRNA activates TLR3 and TLR8, and this synergistic induction of IL-12p70 was recapitulated by the addition of a specific TLR8 agonist with a TLR3 ligand to PBMCs. These data indicate that M. tuberculosis tRNA activates a gene network involving the integration of multiple innate signals, including types I and II IFNs, as well as distinct cell types to induce IL-12p70.


Figures

Fig 1
Fig 1. Network analysis of M. tuberculosis tRNA, ssRNA, and TLR2/1L-induced gene expression profiles in PBMC
(A) Principle component analysis of correlation of gene expression from RNAseq on rLog() matrix output from DESeq2. Ellipse denotes 95% confidence interval from k-means clustering of PC1 and PC2 variance. (B) Hierarchical clustering of rLog() transformed counts. Euclidean distance, complete clustering. (C) Overlap of significantly induced genes by mTB tRNA, ssRNA and TLR2/1L, defined by FC > 2 over Media and FDR < 0.05. Hypergeometric p-value calculated for overlaps excluding the 396 common genes. (D) Top Bio Functions identified by Ingenuity Pathway Analysis of significantly induced genes for mTB tRNA, ssRNA or TLR2/1L. (E) Comparison of significantly induced functional pathways induced by mTB tRNA to ssRNA or TLR2/1L.
Fig 2
Fig 2. Identification of RNA – correlated module and associated functional analysis
(A) WGCNA eigengene modules correlated to at least one treatment condition P < 0.05. Red indicates positive correlation and green inverse correlation. (B) Top hits for functional term annotation of WGCNA modules positively correlated with mTB tRNA and ssRNA or TLR2/1L signatures. Padj is calculated by ClueGO as the P-value with Bonferroni correction for the association of the functional term with the gene expression data. Ratio represents the genes for a given functional term that are present in the module over the total number of genes for the term. (C) Visualization of the gene network derived from the WGCNA turquoise module. The module was filtered for genes exhibiting significant differential expression during tRNA treatment and annotated with the GO term “immune pathway” to select genes associated response to mTB infection.
Fig 3
Fig 3
Integrated network of gene expression and functional analysis terms. Gephi was used to create a functional annotation network, showing connections between significant gene ontology terms, IPA canonical pathways, WGCNA modules and significantly expressed genes.
Fig 4
Fig 4. Analysis of genes characteristic of Th1 differentiation and validation in PBMC
(A) Log-transformed, normalized counts for select genes at 6h and 24h, mean ± SEM, statistical significance of differential expression (as compared to media at each timepoint) is reported as Benjamini-Hochberg adjusted p-value. (B) PBMC were stimulated with mTB tRNA, ssRNA or TLR2/1L and cytokine secretion measured at 24h. (n=20). Statistical significance of ligand-stimulated PBMC vs. media control calculated by one-way repeated measures ANOVA followed by Dunnett’s multiple comparisons test. *p<= 0.05, ** p<=0.01, *** p<=0.001
Fig 5
Fig 5. Role of IL-18 and Type I IFN
(A) PBMC were stimulated with mTB tRNA, ssRNA or TLR2/1L and cytokine secretion measured at 1 h, 6 h and 24 h from PBMC stimulated as above. (n=7). Statistical significance of ligand-stimulated PBMC at specific timepoints vs. media control calculated by two-way repeated measures ANOVA followed by Dunnett’s multiple comparisons test. (B) PBMC were pre-treated with monoclonal anti-IL-18 neutralizing antibody or IgG1 isotype control (n=4) or (C) anti-IFNAR neutralizing antibody or IgG2a isotype control (n=3) for 30 m before stimulation with TLR2/1L, ssRNA or mTB tRNA. Supernatants were collected at 24 h and cytokine secretion measured. Statistical significance of ligand-stimulated PBMC vs. media control in the presence of neutralizing and isotype control antibodies calculated by one-way ANOVA followed by Tukey post-hoc test. *p<= 0.05, ** p<=0.01, *** p<=0.001. Data are represented as mean ± SEM. The data within each subfigure were derived from independent donors.
Fig 6
Fig 6. Role for IFN-γ and NK cells
(A) PBMC were depleted of CD56+ cells, stimulated as shown and cytokine secretion measured at 24h (n=3). Statistical significance calculated by one-way repeated measures ANOVA and Šidák correction applied to the multiple comparison between PBMC and CD56 depleted populations. (B) PBMC were stimulated, and Brefeldin A added at 20h to arrest cytokine secretion. Cells were collected at 24h, stained with CD3-FITC, CD56-PE and IFN-γ-APC and measured by Flow cytometry. IFN-γ+ lymphocytes were divided into subpopulations determined by CD3/CD56 staining and shown as percentage of parent (IFN-γ+) population (n=3). (C) PBMC were pre-treated with monoclonal anti-IFN-γ neutralizing antibody for 30m before stimulation as previous. Cytokine secretion was measured at 24h (n=6). (D) PBMC were pre-treated with monoclonal anti-IFN-γ neutralizing antibody for 30m before stimulation as previous. Cytokine secretion was measured at 24h (n=3). Data are represented as mean ± SEM. Statistical significance of ligand-stimulated PBMC in the presence of neutralizing or isotype control antibodies for B, C, and D was calculated by two-way ANOVA followed by Tukey post-hoc test. *p<= 0.05, ** p<=0.01, *** p<=0.001
Fig 7
Fig 7. Role of TLR8 and synergy with TLR3
(A) PBMC were pre-treated with TLR8 antagonist or control for 30m before treatment with TLR2/1L, ssRNA and mTB tRNA. Cytokine secretion was measured at 24h. (IL-18 and IL-6: (n=3); IL-12p70 and IFN-γ (n=5). Statistical significance calculated by two-way repeated measures ANOVA and multiple comparisons by Tukey post-hoc test. * P < 0.05, ** P < 0.01. (B) PBMC were stimulated with nucleotide oligomers complexed with Dotap (endosomal PRR) or Lipofectamine2000 (cytosolic PRR) or synthetic agonists for 24h (n>=4). Statistical significance of ligand-stimulated PBMC vs. media calculated by one-way repeated measures ANOVA followed by Dunnett’s multiple comparisons test. (C) PBMC were stimulated with poly I:C, TL8-506 or combination and cytokine secretion measured at 24h (n=3). Data summarized using a mixed-effects model with a fixed effect for ligand and a random effect for subject. A two-way interaction term was fit to each ligand to test synergy. The likelihood ratio test was used to test for statistical significance. Data are represented as mean ± SEM. *p<= 0.05, ** p<=0.01, *** p<=0.001
Fig. 8
Fig. 8. M. tuberculosis tRNA triggers the induction of IL-12p70
This model, based on the experimental data in this manuscript as well as the literature, shows that mTB tRNA induces secretion of IL-18 via TLR8. Type I IFNs may contribute to enhanced induction of IL-12p35 via upregulation of TLR3, which in combination with IL-12p40 induction leads to secretion of bioactive IL-12p70. IL-12p70 upregulates IL-18 receptor on NK cells, facilitating the ability of IL-18 and IL-12p70 to synergize to induce secretion of IFN-γ. IFN-γ in turn enhances IL-12p70 secretion. The key cell types in this process are monocytes/macrophages, NK cells and myeloid DC.

References

    1. Bloom BR, Murray CJL. Tuberculosis: commentary on a reemergent killer. Science. 1992;257:1055–1064. - PubMed
    1. Seibert FB. The isolation of a crystalline protein with tuberculin activity. Science. 1926;63:619c–620. - PubMed
    1. Long ER, Seibert FB. The chemical composition of the active principle of tuberculin. VII. The evidence that the active principle is a protein. Am. Rev. Tuberc. 1926;13:448.
    1. Seibert FB. X. The isolation in crystalline form and identification of the active principle of tuberculin. Am Rev Tuberc. 1928;17:402–421.
    1. Seibert FB. The isolation and properties of the purified protein derivative of tuberculin. Am. Rev. Tuberc. 1934;30:713–720.

Publication types

MeSH terms