. 2018 Apr 17;115(16):4176-4181.
doi: 10.1073/pnas.1717800115. Epub 2018 Apr 2.

Increased autophagy blocks HER2-mediated breast tumorigenesis

Affiliations

Increased autophagy blocks HER2-mediated breast tumorigenesis

Silvia Vega-Rubín-de-Celis et al. Proc Natl Acad Sci U S A. .

Abstract

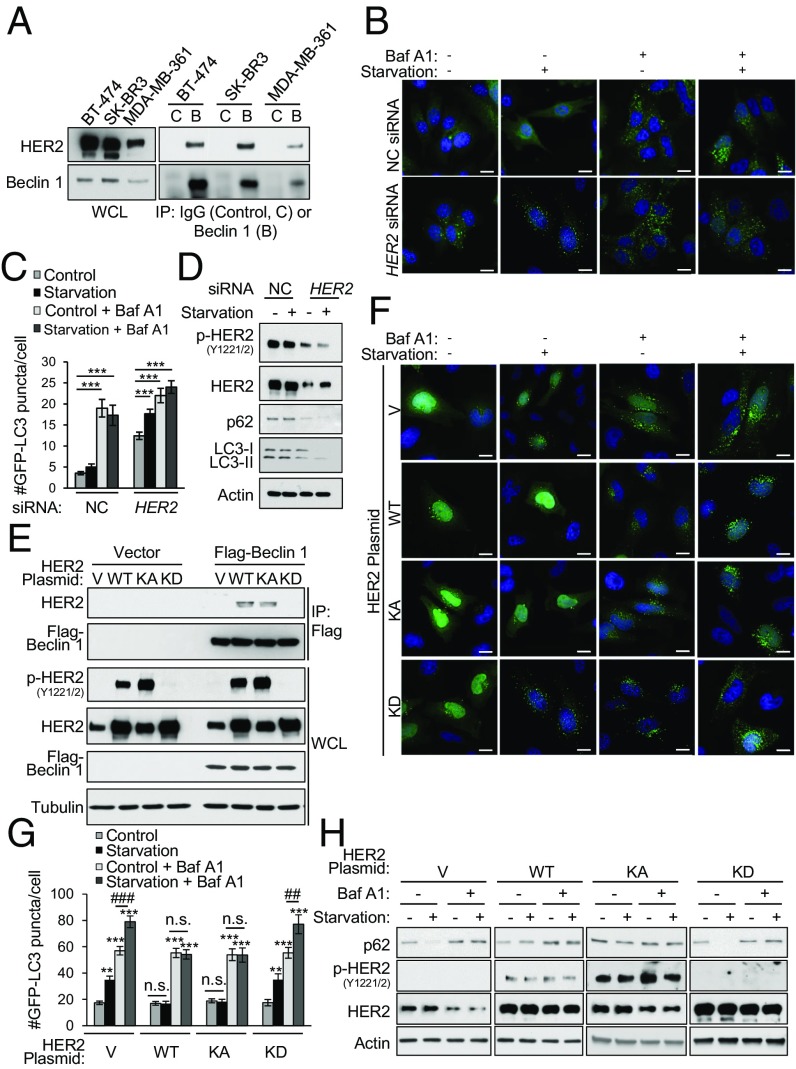
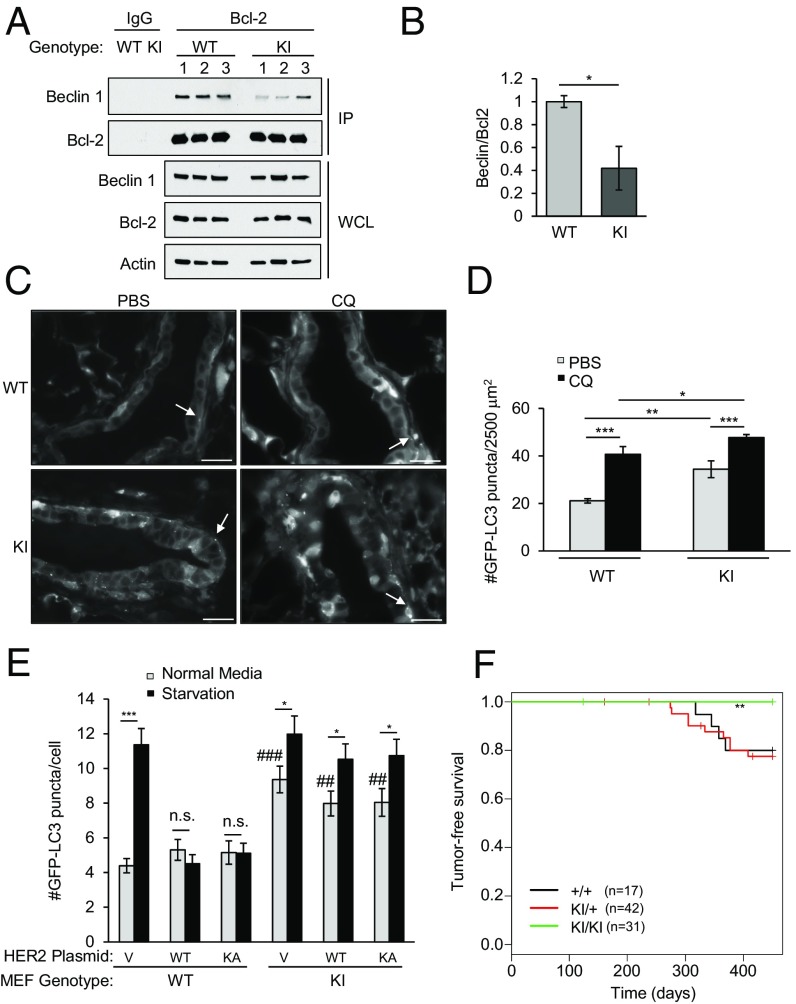
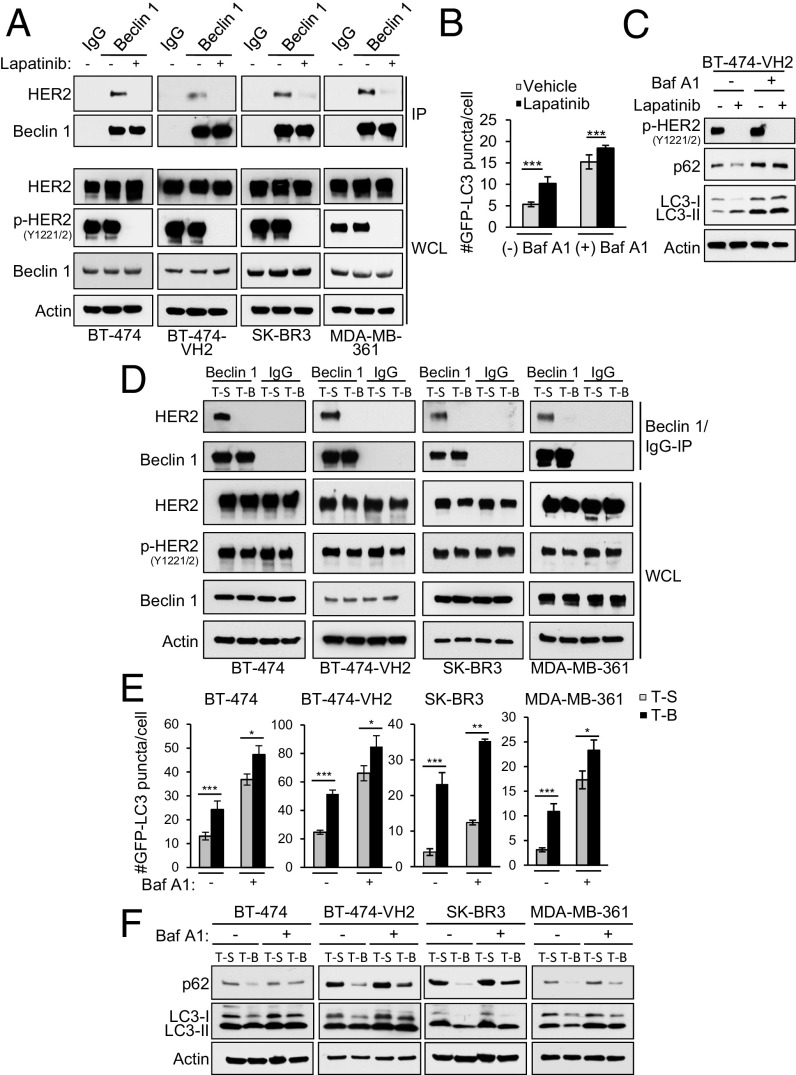
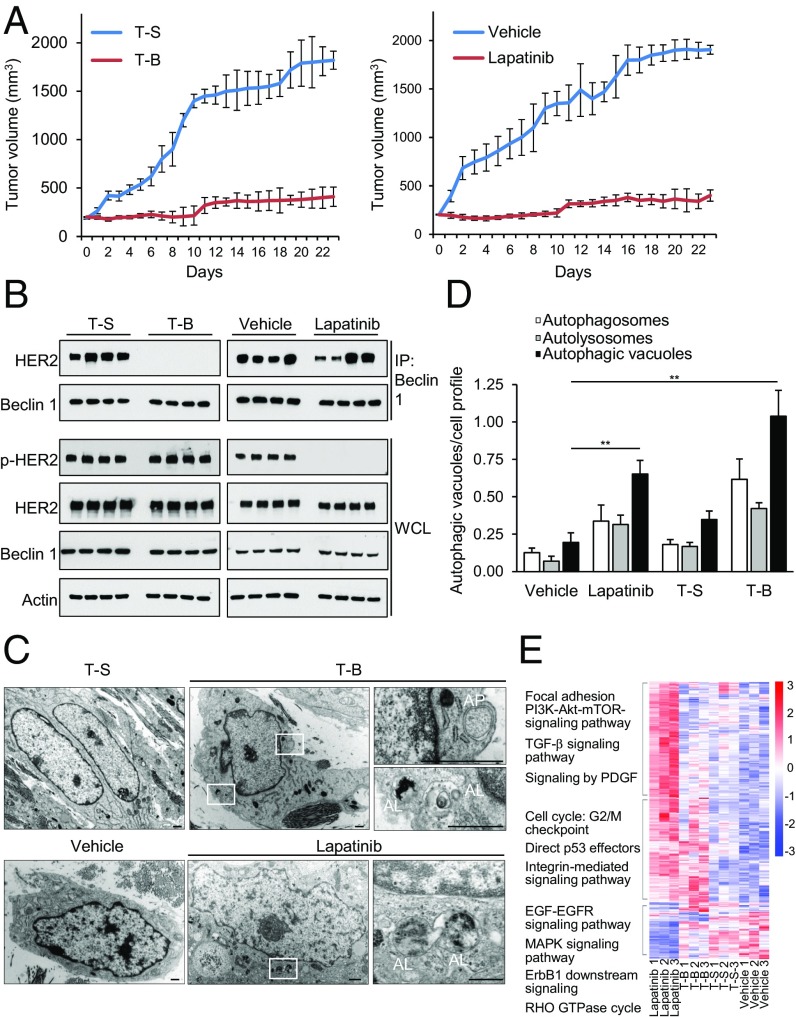
Allelic loss of the autophagy gene, beclin 1/BECN1, increases the risk of patients developing aggressive, including human epidermal growth factor receptor 2 (HER2)-positive, breast cancers; however, it is not known whether autophagy induction may be beneficial in preventing HER2-positive breast tumor growth. We explored the regulation of autophagy in breast cancer cells by HER2 in vitro and the effects of genetic and pharmacological strategies to increase autophagy on HER2-driven breast cancer growth in vivo. Our findings demonstrate that HER2 interacts with Beclin 1 in breast cancer cells and inhibits autophagy. Mice with increased basal autophagy due to a genetically engineered mutation in Becn1 are protected from HER2-driven mammary tumorigenesis, and HER2 fails to inhibit autophagy in primary cells derived from these mice. Moreover, treatment of mice with HER2-positive human breast cancer xenografts with the Tat-Beclin 1 autophagy-inducing peptide inhibits tumor growth as effectively as a clinically used HER2 tyrosine kinase inhibitor (TKI). This inhibition of tumor growth is associated with a robust induction of autophagy, a disruption of HER2/Beclin 1 binding, and a transcriptional signature in the tumors distinct from that observed with HER2 TKI treatment. Taken together, these findings indicate that the HER2-mediated inhibition of Beclin 1 and autophagy likely contributes to HER2-mediated tumorigenesis and that strategies to block HER2/Beclin 1 binding and/or increase autophagy may represent a new therapeutic approach for HER2-positive breast cancers.

Keywords: Beclin 1; HER2; autophagy; breast cancer.


Conflict of interest statement

The authors declare no conflict of interest.

Figures

Fig. 1.
Fig. 1.
HER2 interacts with Beclin 1 and reduces starvation-induced autophagy. (A) Coimmunoprecipitation of endogenous HER2 with endogenous Beclin 1 in indicated HER2-positive breast cancer cell lines. B, Beclin 1 IgG; C, Control IgG; IP, immunoprecipitation; WCL, whole-cell lysates. (B and C) HER2 knockdown effects on autophagy in BT-474 cells cotransfected with GFP-LC3 and a nontargeting control (NC) or HER2 siRNA and grown in either normal media (starvation, −) or starvation conditions (starvation, +; HBSS, 3 h) in the presence or absence of 100 nM Baf A1. Representative images (B) and quantification (C) of GFP-LC3 puncta are shown. (D) Western blot analysis of autophagy (p62 and LC3) in BT-474 cells treated with NC or HER2 siRNA and grown in normal media or starvation conditions. (E) Coimmunoprecipitation of indicated HER2 constructs with Flag-Beclin 1 in transiently transfected HeLa cells. V, empty vector. (F and G) HER2 effects on autophagy in HeLa cells cotransfected with GFP-LC3 and the indicated HER2 expression plasmid and grown in normal media or starvation conditions (HBSS, 3 h) ± 50 nM Baf A1. Representative images (F) and quantification (G) of GFP-LC3 puncta. (H) Western blot analysis of autophagy (p62) in HeLa cells transfected with the indicated HER2 expression plasmid, and grown in normal media or starvation conditions for 3 h ± 100 nM Baf A1. Bars are mean ± SEM of triplicate samples (100–150 cells per condition). Similar results were observed in three independent experiments. n.s., not significant. **P < 0.01 and ***P < 0.001 vs. normal media control, one-way ANOVA; ##P < 0.01 and ###P < 0.001 for comparison of starvation vs. normal media in the presence of Baf A1, one-way ANOVA (see also Fig. S2). (Scale bars, 15 μm.)
Fig. 2.
Fig. 2.
Becn1F121A knock-in mice have decreased HER2-mediated tumorigenesis. (A) Coimmunoprecipitation of Beclin 1 with Bcl-2 in mammary glands of 2-mo-old female Becn1WT (WT) and homozygous Becn1F121A (KI) mice (three mice per genotype). IP, immunoprecipitation; WCL, whole-cell lysates. (B) Densimetric quantification of the ratio of Beclin 1 compared with Bcl-2 in each sample in A normalized to a 1.0 value in the mammary glands of WT mice. Bars are mean values ± SEM of mammary glands from three mice per group. *P < 0.05; ANOVA. Representative images (C) and quantification of GFP-LC3 puncta (D) are shown in mammary epithelial ducts of Becn1WT:GFP-LC3 (WT) and Becn1F121A:GFP-LC3 (KI) mice 6 h after treatment with PBS or 50 mg⋅kg−1 chloroquine (CQ). White arrows denote representative GFP-LC3 puncta in C. *P < 0.05; ***P < 0.001; ANOVA. (E) GFP-LC3 puncta (autophagosomes) in MEFs of the indicated genotype transfected with the indicated HER2 expression plasmids and GFP-LC3 and grown in normal media or subjected to starvation (HBSS, 3 h). Bars are mean ± SEM of triplicate samples (100–150 cells per condition). Similar results were observed in three independent experiments. n.s., not significant. *P < 0.01 and ***P < 0.001 vs. normal media control; ##P < 0.01 and ###P < 0.001 for comparison of value in normal media in the indicated condition in KI MEFs vs. WT MEFs. (F) Kaplan–Meier curves for tumor-free survival of Becn1WT (+/+) Becn1WT/F121A (KI/+), and Becn1F121A (KI/KI) mice crossed with MMTV-HER2 mice. **P < 0.01; log-rank test (see also Fig. S3). (Scale bars, 100 μm.)
Fig. 3.
Fig. 3.
Lapatinib and Tat-Beclin 1 disrupt HER2/Beclin 1 binding and induce autophagy in breast cancer cells. (A) Effects of lapatinib on HER2/Beclin 1 coimmunoprecipitation in HER2-positive breast cancer cell lines treated with control (DMSO) or lapatinib (1 μM, 3 h). IP, immunoprecipitation; WCL, whole-cell lysates. (B) Quantification of GFP-LC3 puncta (autophagosomes) in BT-474-VH2 cells in the ±1 μM lapatinib and ±100 nM Baf A1. (C) Western blot analysis of p62 degradation in cells treated as in A. (D) Effects of Tat-Beclin 1 (T-B) or control Tat-Scrambled (T-S) peptides (5 μM, 2 h) on HER2/Beclin 1 coimmunoprecipitation in HER2-positive breast cancer cell lines. (E) Quantification of GFP-LC3 puncta (autophagosomes) in the indicated HER2-positive breast cancer cell line after treatment with T-B or T-S (10 μM, 1 h) ± 100 nM Baf A1. (F) Western blot analysis of p62 and LC3I/II levels in the indicated HER2-positive cancer cell line treated as in E. Bars are mean ± SEM of triplicate samples (100–150 cells per condition). Similar results were observed in three independent experiments. *P < 0.05, **< 0.01, ***P < 0.001 for indicated comparison; ANOVA.
Fig. 4.
Fig. 4.
Tat-Beclin 1 decreases HER2 breast cancer xenograft growth. (A) Effect of Tat-Beclin 1 (T-B) versus Tat-Scrambled (T-S) control peptide (Left) and vehicle versus lapatinib (Right) on growth of BT-474-VH2 xenografts in nude mice. P = 5.3E-94 (Left) and P = 1.0E-53 (Right), linear mixed-effect model. The difference between Tat-Beclin 1 and lapatinib was not significant (P = 0.236). Shown are results from one cohort of 40 mice randomized to four treatment groups. Similar results were observed in three independent cohorts. (B) Effect of lapatinib and T-B on Beclin 1/HER2 interaction and HER2 phosphorylation in BT-474-VH2 xenografts. Samples were harvested after 3 d of daily treatment with the indicated agent. IP, immunoprecipitation; WCL, whole-cell lysates. (C) Representative images of ultrastructural analyses of BT-474-VH2 xenografts with the indicated treatment. Representative autophagosomes (AP) and representative autolysosomes (AL) would be scored as positive in D. (D) Quantification of autophagic structures in xenografts with the indicated treatment. Bars are mean values ± SEM of three xenografts per treatment group. At least 50 cell profiles were counted per xenograft sample. **P = 0.01; t test. (E) Heat map profile of the expression data derived from RNAseq of BT-474-VH2 xenografts comparing lapatinib-, Tat-Beclin 1 (T-B)–, Tat-Scrambled (T-S)–, and vehicle-treated groups (n = 3 animals per group). Gene clusters were identified and annotated based on statistically (P < 0.01) significant pathways observed within each cluster (see also Fig. S5 and Datasets S1–S3).

References

    1. Ross JS, et al. The HER-2 receptor and breast cancer: ten years of targeted anti-HER-2 therapy and personalized medicine. Oncologist. 2009;14:320–368. - PubMed
    1. Petrelli F, et al. Clinical and pathological characterization of HER2 mutations in human breast cancer: a systematic review of the literature. Breast Cancer Res Treat. 2017;166:339–349. - PubMed
    1. Foster SA, et al. Activation mechanism of oncogenic deletion mutations in BRAF, EGFR, and HER2. Cancer Cell. 2016;29:477–493. - PubMed
    1. Gingras I, Gebhart G, de Azambuja E, Piccart-Gebhart M. HER2-positive breast cancer is lost in translation: time for patient-centered research. Nat Rev Clin Oncol. 2017;14:669–681. - PubMed
    1. Higgins MJ, Baselga J. Targeted therapies for breast cancer. J Clin Invest. 2011;121:3797–3803. - PMC - PubMed

Publication types

MeSH terms