

Direct electrochemical observation of glucosidase activity in isolated single lysosomes from a living cell
- PMID: 29610324
- PMCID: PMC5910846
- DOI: 10.1073/pnas.1719844115
Direct electrochemical observation of glucosidase activity in isolated single lysosomes from a living cell
Abstract
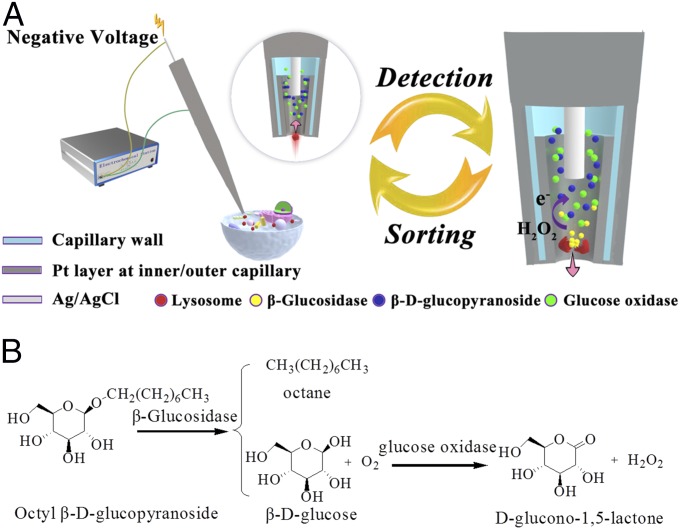
The protein activity in individual intracellular compartments in single living cells must be analyzed to obtain an understanding of protein function at subcellular locations. The current methodology for probing activity is often not resolved to the level of an individual compartment, and the results provide an extent of reaction that is averaged from a group of compartments. To address this technological limitation, a single lysosome is sorted from a living cell via electrophoresis into a nanocapillary designed to electrochemically analyze internal solution. The activity of a protein specific to lysosomes, β-glucosidase, is determined by the electrochemical quantification of hydrogen peroxide generated from the reaction with its substrate and the associated enzymes preloaded in the nanocapillary. Sorting and assaying multiple lysosomes from the same cell shows the relative homogeneity of protein activity between different lysosomes, whereas the protein activity in single lysosomes from different cells of the same type is heterogeneous. Thus, this study for the analysis of protein activity within targeted cellular compartments allows direct study of protein function at subcellular resolution and provides unprecedented information about the homogeneity within the lysosomal population of a single cell.
Keywords: electrochemical observation; glucosidase activity; nanocapillary; single lysosomes; subcellular analysis.
Copyright © 2018 the Author(s). Published by PNAS.
Conflict of interest statement
The authors declare no conflict of interest.
Figures

Similar articles
-
Nanokits for the electrochemical quantification of enzyme activity in single living cells.Methods Enzymol. 2019;628:173-189. doi: 10.1016/bs.mie.2019.06.015. Epub 2019 Jul 9. Methods Enzymol. 2019. PMID: 31668228
-
Insights into the "free state" enzyme reaction kinetics in nanoconfinement.Lab Chip. 2013 Apr 21;13(8):1546-53. doi: 10.1039/c3lc41319e. Lab Chip. 2013. PMID: 23429726
-
[Chemical galactosylation of acid alpha-glucosidase to provide directed transport of the enzyme into lysosomes of liver parenchymal cells].Vopr Med Khim. 1987 Sep-Oct;33(5):15-20. Vopr Med Khim. 1987. PMID: 2825427 Review. Russian.
-
Self-Referenced Nanopipette for Electrochemical Analysis of Hydrogen Peroxide in the Nucleus of a Single Living Cell.Anal Chem. 2021 Aug 10;93(31):10744-10749. doi: 10.1021/acs.analchem.0c05025. Epub 2021 Jul 27. Anal Chem. 2021. PMID: 34314583
-
The subcellular localization of soluble and membrane-bound lysosomal enzymes in I-cell fibroblasts: a comparative immunocytochemical study.Eur J Cell Biol. 1985 Nov;39(1):179-89. Eur J Cell Biol. 1985. PMID: 2935398
Cited by
-
Robotic Intracellular Electrochemical Sensing for Adherent Cells.Cyborg Bionic Syst. 2022 Sep 2;2022:9763420. doi: 10.34133/2022/9763420. eCollection 2022. Cyborg Bionic Syst. 2022. PMID: 36285318 Free PMC article.
-
Electrogenerated chemiluminescence detection of single entities.Chem Sci. 2021 Mar 18;12(16):5720-5736. doi: 10.1039/d0sc07085h. Chem Sci. 2021. PMID: 34168801 Free PMC article. Review.
-
A High Spatiotemporal Iontronic Single-Cell Viscometer.Research (Wash D C). 2022 Jun 29;2022:9859101. doi: 10.34133/2022/9859101. eCollection 2022. Research (Wash D C). 2022. PMID: 39759158 Free PMC article.
-
Plasmonic probing of the adhesion strength of single microbial cells.Proc Natl Acad Sci U S A. 2020 Nov 3;117(44):27148-27153. doi: 10.1073/pnas.2010136117. Epub 2020 Oct 15. Proc Natl Acad Sci U S A. 2020. PMID: 33060295 Free PMC article.
-
Nanoelectrochemical Monitoring of pH-Regulated Reactive Oxygen and Nitrogen Species Homeostasis in Macrophages Lysosomes during Phagocytosis.Research (Wash D C). 2025 Jun 5;8:0733. doi: 10.34133/research.0733. eCollection 2025. Research (Wash D C). 2025. PMID: 40475095 Free PMC article.
References
-
- Larance M, Lamond AI. Multidimensional proteomics for cell biology. Nat Rev Mol Cell Biol. 2015;16:269–280. - PubMed
-
- Yates JR, 3rd, Gilchrist A, Howell KE, Bergeron JJM. Proteomics of organelles and large cellular structures. Nat Rev Mol Cell Biol. 2005;6:702–714. - PubMed
-
- Betzig E, et al. Imaging intracellular fluorescent proteins at nanometer resolution. Science. 2006;313:1642–1645. - PubMed
Publication types
MeSH terms
Substances
LinkOut - more resources
Full Text Sources
Other Literature Sources
Molecular Biology Databases
