. 2018 Apr 17;115(16):E3692-E3701.
doi: 10.1073/pnas.1714376115. Epub 2018 Apr 2.

Accurate and sensitive quantification of protein-DNA binding affinity

Affiliations

Accurate and sensitive quantification of protein-DNA binding affinity

Chaitanya Rastogi et al. Proc Natl Acad Sci U S A. .

Abstract

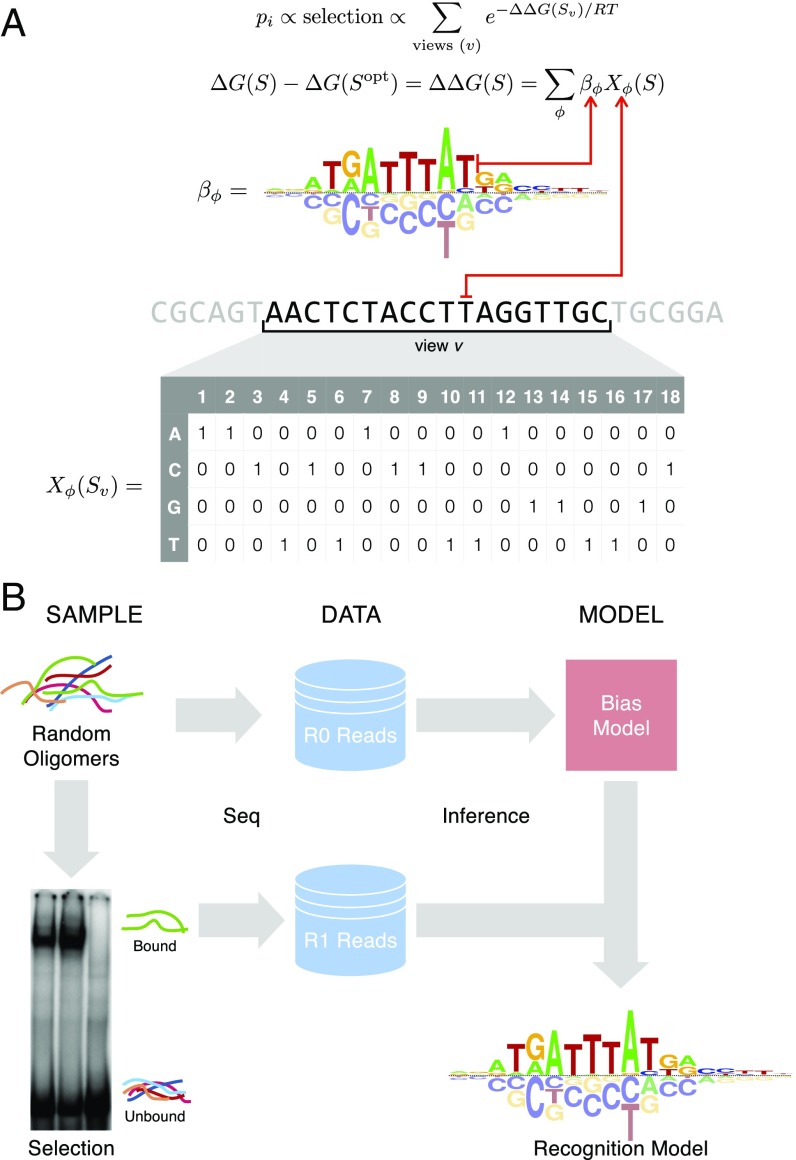
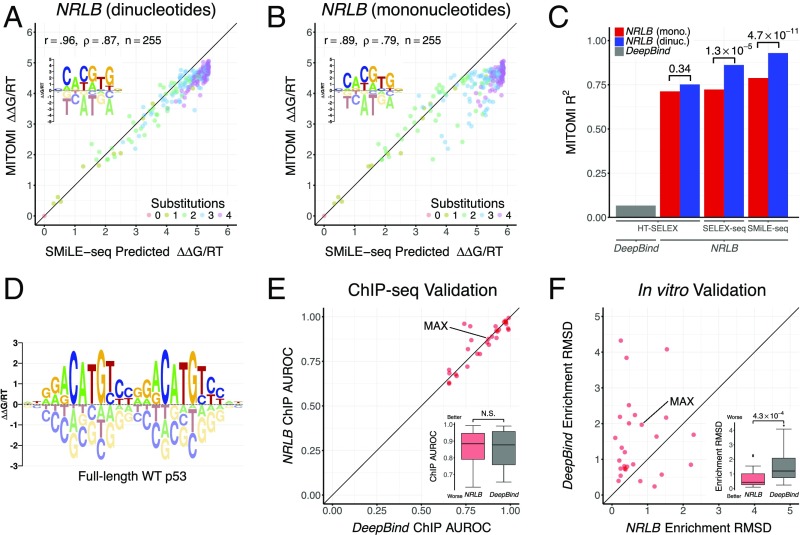
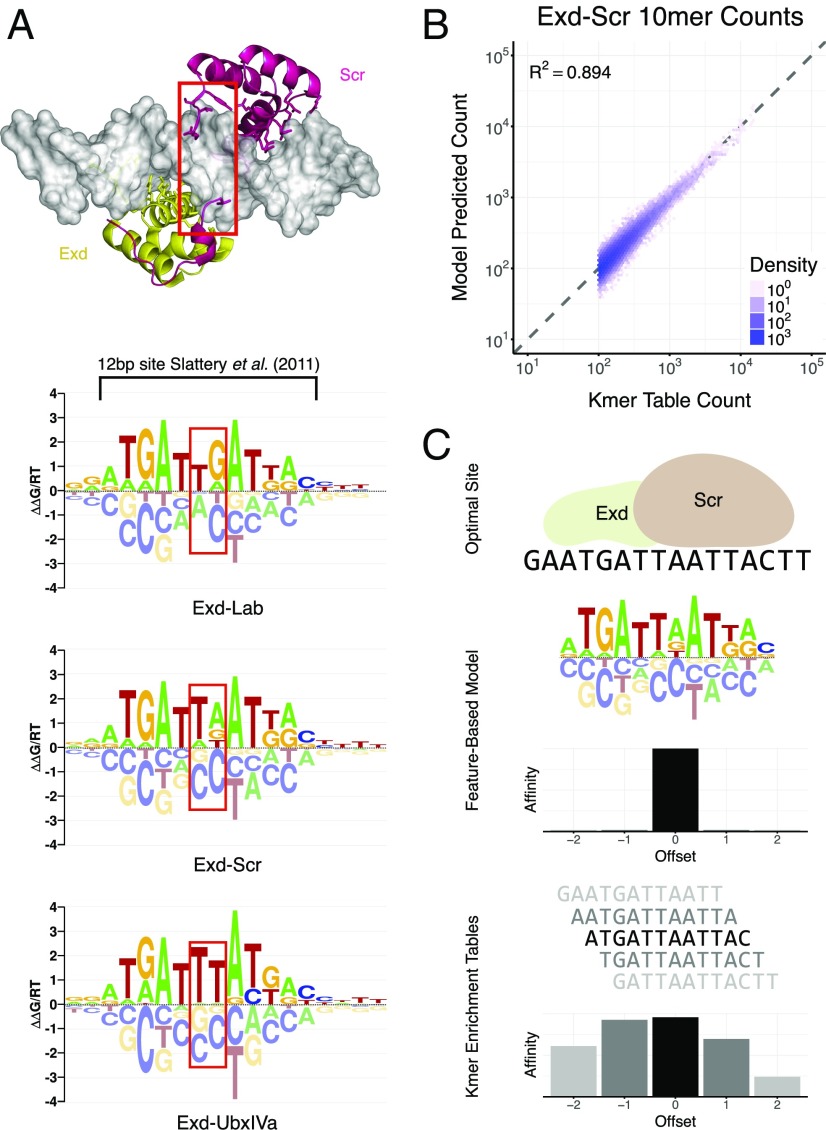
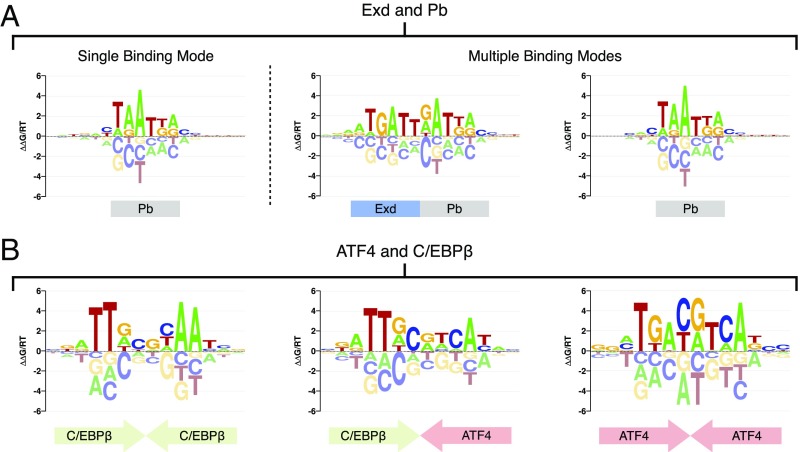
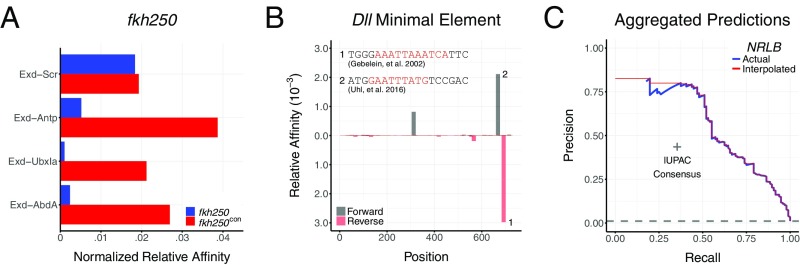
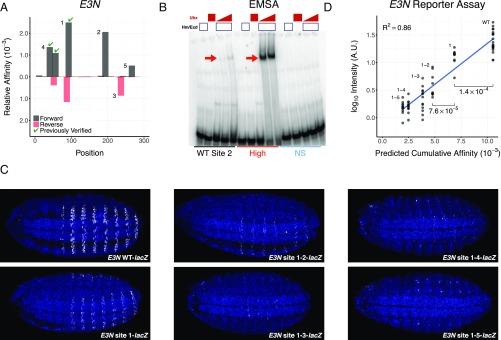
Transcription factors (TFs) control gene expression by binding to genomic DNA in a sequence-specific manner. Mutations in TF binding sites are increasingly found to be associated with human disease, yet we currently lack robust methods to predict these sites. Here, we developed a versatile maximum likelihood framework named No Read Left Behind (NRLB) that infers a biophysical model of protein-DNA recognition across the full affinity range from a library of in vitro selected DNA binding sites. NRLB predicts human Max homodimer binding in near-perfect agreement with existing low-throughput measurements. It can capture the specificity of the p53 tetramer and distinguish multiple binding modes within a single sample. Additionally, we confirm that newly identified low-affinity enhancer binding sites are functional in vivo, and that their contribution to gene expression matches their predicted affinity. Our results establish a powerful paradigm for identifying protein binding sites and interpreting gene regulatory sequences in eukaryotic genomes.

Keywords: SELEX; computational modeling; enhancer assays; low-affinity binding sites; transcription factors.


Conflict of interest statement

The authors declare no conflict of interest.

Figures

Fig. 1.
Fig. 1.
Overview of the NRLB algorithm for modeling SELEX data. (A) Biophysical model underlying NRLB uses a feature-based representation of binding free energy (Top) and a sliding window sum over all possible binding locations or views v in the probe (Bottom). Mononucleotide free energy parameters βϕ can be represented using an energy logo (19). The occurrence of sequence feature ϕ in subsequence Sv is represented by the indicator Xϕ (gray matrix). (B) Schematic diagram illustrating SELEX-seq library construction and analysis workflow.
Fig. 2.
Fig. 2.
NRLB models accurately quantify binding affinity over large footprints. (A) Scatterplot comparing the binding energy of human MAX to 255 DNA probes measured using MITOMI (9) (y axis) with the binding energies predicted by an NRLB mononucleotide and dinucleotide model trained on R1 SMiLE-seq data (14) with nonspecific binding (x axis). (Inset) Energy logo representation (19) of the NRLB model. Color denotes the number of substitutions relative to the optimal sequence. Pearson (r) and Spearman rank correlation (ρ), along with the number of data points (n), are indicated. (B) Same as A, but using only mononucleotide features. (C) Bar chart showing the correlation between measured and modeled MAX binding energies, computed as in A, for different models. The NRLB models were trained on HT-SELEX, SELEX-seq, and SMiLE-seq datasets, and the DeepBind (30) model was trained on HT-SELEX data for human MAX (compare SI Appendix, Fig. S2). dinuc., dinucleotide; mono., mononucleotide. (D) Energy logo for an NRLB model with dinucleotide features trained on R1 SELEX-seq data for full-length WT p53. In A, B, and D, the energy logo represents the net effect of each single-base mutation of the optimal sequence. (E) Comparison between NRLB and DeepBind performance when classifying ENCODE ChIP-seq peaks using models trained on HT-SELEX data (23). Each point represents the performance of the respective algorithms for a particular TF in terms of area under the receiver operating characteristic curve (AUROC; Methods). N.S., not significant. (F) Performance comparison for the same NRLB and DeepBind models when predicting the enrichment of probe counts between R0 and R1 in a more deeply sequenced replicate of the same dataset (24). Each point represents the performance of the respective algorithms for a particular TF in terms of root-mean-square deviation (RMSD; Methods). Statistical significance was assessed using a Mann–Whitney U test.
Fig. 3.
Fig. 3.
NRLB produces precise, parsimonious, and informative representations of TF behavior. (A) Crystal structure (33) and dinucleotide NRLB models for Exd-Hox heterodimers; red boxes capture previously described differences in spacer preference between Hox proteins from different subclasses, which correspond to differences observed in crystal structures (13). At 18 bp, NRLB models capture a larger footprint than the 12-bp oligomer enrichment tables (black bracket) that were used by Slattery et al. (13). (B) Scatterplot showing the frequencies of observed 10mer counts in R1 Exd-Scr SELEX-seq data versus the frequencies of the same 10mers predicted by the NRLB model in A. Only 10mers with a count of 100 or more were included. (C) Schematic illustrating how oligomer enrichment tables tend to display significant enrichment over multiple offsets, thus confounding structural interpretation, and how feature-based models ensure a consistent definition of the base pair position in the protein–DNA interface. In all panels, Exd-Hox SELEX-seq data from Slattery et al. (13) were used. The Protein Data Bank ID code of the Exd-Scr crystal structure is 2R5Y (33). A truncated version of the Exd-Scr model in B and oligomer enrichment tables for R1 Exd-Scr data from Slattery et al. (13) are used to predict relative affinities.
Fig. 4.
Fig. 4.
NRLB can identify multiple TF complexes in a single sample. (A, Left) Energy logo representation (19) for a single-mode dinucleotide NRLB model fit to R1 SELEX-seq data for Exd-Pb from Slattery et al. (13). (A, Right) Energy logos for two modes from a three-mode dinucleotide NRLB model fit to the same data. (B) Energy logos for all modes from a three-mode dinucleotide NRLB model fit to R1 SELEX-seq data for a mixture of ATF4 and C/EBPβ.
Fig. 5.
Fig. 5.
NRLB predicts functional binding sites in D. melanogaster enhancers. (A) Relative affinities for the fkh250 and fkh250con regulatory elements as predicted by NRLB models for four different Exd-Hox heterodimers. (B) Chart showing the relative affinities of Exd-UbxIa as predicted by an NRLB model (y axis) across the DME (x axis). The top binding sites identified by the model (numbered with sequences indicated) have both been verified previously (34, 35). Gray and red indicate forward and reverse strands, respectively. (C) Precision-recall curve for Hox and Exd-Hox models (blue line), consensus matching methods (gray “+”), and a random classifier (gray dashed line) when identifying 96 functionally validated binding sites across 21 curated D. melanogaster enhancer elements. IUPAC, International Union of Pure and Applied Chemistry. For all analyses, NRLB models were trained on R1 SELEX-seq data from Slattery et al. (13) and are shown in SI Appendix, Fig. S8. In A and B, all relative affinities have been rescaled to highest-affinity sequence in the D. melanogaster genome.
Fig. 6.
Fig. 6.
Functional validation of ultra-low-affinity sites predicted by NRLB. (A) Chart showing the relative affinities of Exd-UbxIa as predicted by an NRLB model (y axis) across the shavenbaby (svb) enhancer element E3N in D. melanogaster (x axis). Gray and red indicate forward and reverse strands, respectively. Sites indicated by a green checkmark were functionally validated in a previous study (1). Numbers correspond to the to the order in which sites were mutated. (B) Gel from an EMSA testing the ability of three sequences to bind Exd-UbxIVa (bands indicated by red arrows) in vitro. The WT sequence corresponds to site 2 in A. An NRLB model for Exd-UbxIVa was used to design additional sequences (Dataset S2) that were predicted to have nonspecific (NS) and near-optimal (High) binding affinity. (C) Expression (white) of E3N::lacZ reporter constructs where the binding sites identified in A were sequentially mutated. WT indicates the WT E3N enhancer element, while site 1, site 1-2, etc. indicate the mutations of site 1, sites 1 and 2, etc. (D) Comparison between the NRLB predicted cumulative affinities for Exd-UbxIVa (x axis) and log10 reporter expression level (y axis) for every reporter construct (labels) as quantitated from C. Each point represents the reporter expression level of a single embryo (Methods). The blue line denotes the result of a linear model fit. Mutation of sites 1 and 2 demonstrates statistically significant changes in reporter intensity (Mann–Whitney U test). For all analyses, NRLB models were trained on R1 SELEX-seq data for Exd-UbxIVa from Slattery et al. (13) and are shown in SI Appendix, Fig. S8.

References

    1. Crocker J, et al. Low affinity binding site clusters confer hox specificity and regulatory robustness. Cell. 2015;160:191–203. - PMC - PubMed
    1. Farley EK, et al. Suboptimization of developmental enhancers. Science. 2015;350:325–328. - PMC - PubMed
    1. Lee TI, et al. Transcriptional regulatory networks in Saccharomyces cerevisiae. Science. 2002;298:799–804. - PubMed
    1. Johnson DS, Mortazavi A, Myers RM, Wold B. Genome-wide mapping of in vivo protein-DNA interactions. Science. 2007;316:1497–1502. - PubMed
    1. ENCODE Project Consortium An integrated encyclopedia of DNA elements in the human genome. Nature. 2012;489:57–74. - PMC - PubMed

Publication types