. 2018 Apr 17;115(16):E3712-E3721.
doi: 10.1073/pnas.1721648115. Epub 2018 Apr 2.

Spatial organization and dynamics of RNase E and ribosomes in Caulobacter crescentus

Affiliations

Spatial organization and dynamics of RNase E and ribosomes in Caulobacter crescentus

Camille A Bayas et al. Proc Natl Acad Sci U S A. .

Abstract

We report the dynamic spatial organization of Caulobacter crescentus RNase E (RNA degradosome) and ribosomal protein L1 (ribosome) using 3D single-particle tracking and superresolution microscopy. RNase E formed clusters along the central axis of the cell, while weak clusters of ribosomal protein L1 were deployed throughout the cytoplasm. These results contrast with RNase E and ribosome distribution in Escherichia coli, where RNase E colocalizes with the cytoplasmic membrane and ribosomes accumulate in polar nucleoid-free zones. For both RNase E and ribosomes in Caulobacter, we observed a decrease in confinement and clustering upon transcription inhibition and subsequent depletion of nascent RNA, suggesting that RNA substrate availability for processing, degradation, and translation facilitates confinement and clustering. Importantly, RNase E cluster positions correlated with the subcellular location of chromosomal loci of two highly transcribed rRNA genes, suggesting that RNase E's function in rRNA processing occurs at the site of rRNA synthesis. Thus, components of the RNA degradosome and ribosome assembly are spatiotemporally organized in Caulobacter, with chromosomal readout serving as the template for this organization.

Keywords: RNA degradation; RNA processing; ribosomes; single-molecule tracking; superresolution microscopy.


Conflict of interest statement

The authors declare no conflict of interest.

Figures
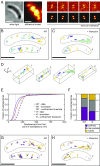
Fig. 1.
Fig. 1.
SPT of RNase E molecules measures decreased confinement when transcription is inhibited by rif. (A, Left) Representative white-light (WL) and diffraction-limited (DL) images of a live Caulobacter cell expressing RNase E-eYFP. The DL image displayed was taken during the initial bleach down of eYFP. (A, Right) Example images of SMs in subsequent frames used to produce a SM trajectory. The DH-PSF experimental raw data (Top row) matches well to the fit to two 2D Gaussians done through easy-DHPSF (Bottom row). The midpoint of the two lobes provides xy position, while the angle between the two lobes encodes axial position. (B) Two representative WT cells with their RNase E trajectories. (C) Two representative rif-treated cells and trajectories. Each trajectory is plotted as a different color. Only trajectories of at least four steps (five frames or 125 ms) are shown and analyzed. The cell outline is indicated by the dashed brown line. (D) Three-dimensional perspective views of the trajectories in B and C. (E) CDF of displacements used for confinement analysis. Thresholds for classifying a subtrajectory as “confined” or “mobile” were set each for WT and rif-treated cells, and were chosen to be the 5th percentile of the Brownian simulations for confined (pink and light blue dashed lines) and 50th percentile for mobile. All other subtrajectories are defined as “intermediate.” (F) Results from confinement analysis. (G and H) Same cells as in B and C but with the subtrajectories color-coded according to their assigned confinement type. Analysis was performed on 2,817 trajectories from 302 WT cells and 2,709 trajectories from 351 rif-treated cells. [Scale bars: 500 nm (A and D); 1,000 nm (B, C, G, and H).]
Fig. 2.
Fig. 2.
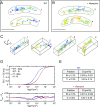
SPT of single ribosomal L1 molecules reveals faster diffusion in cells in which RNA has been depleted, as well as free and ribosome-bound L1. (A) Example WT cells and their trajectories. (B) Example rif-treated cells and their trajectories. Each trajectory is plotted as a different color. Only trajectories of at least four steps (five frames or 125 ms) are shown and analyzed. (C) Three-dimensional perspective views of the trajectories in A and B. (D, Top) Semilog plot of the CDF of squared displacements. (D, Bottom) Residuals of the fit to the CDF of squared displacements. (E) Summary of the two diffusing populations in WT and rif-treated cells. Errors are SDs from 500 bootstrapped samples. [Scale bars: 1,000 nm (A and B); 500 nm (C).] Analysis was performed on 11,249 trajectories from 298 WT cells and 12,757 trajectories from 326 rif-treated cells.
Fig. 3.
Fig. 3.
Spatial clustering of RNase E and ribosomes decreases when RNA is depleted. (A) Example fixed cell expressing RNase E-eYFP (yellow) with its cell surface labeled with rhodamine spirolactam (magenta). (B) Distribution of distances of RNase E molecules to the cell’s central axis. (C) Distribution of distances of rhodamine lactam molecules to the cell’s central axis. (D) A yz projection of a 300-nm slice perpendicular to the cell axis. (E) SR reconstruction of a fixed WT Caulobacter cell expressing RNase E-eYFP, with calculation of the H(r) clustering metric (below) for the data as well as for CSR (complete spatial randomness). (F) SR reconstruction of a fixed rif-treated RNase E cell. (G) SR reconstruction of a fixed WT Caulobacter cell expressing ribosomal protein L1-eYFP. (H) SR reconstruction of a fixed rif-treated L1 cell. In the H function curves plotted in EH, the lighter gray and lighter yellow (E and F)/lighter blue (G and H) show the 95% confidence intervals. In the reconstructions, each localization is plotted as a 3D Gaussian with a σ equivalent to the average xy localization precision of the localizations in each cell (29/30 nm in xy for RNase E and 24/25 nm in xy for ribosomes). An average of 120 molecules and 720 molecules are plotted for RNase E and ribosomes, respectively. Cells are on 1-μm grids. (I) The degree of clustering quantity plotted in F and G were calculated from the area between the data curve and CSR. (J) Distributions for RNase E WT and rif-treated cells showing clustering relative to CSR. (K) Distributions for L1 WT and rif-treated cells showing clustering relative to CSR. Analysis was performed on 218 WT and 135 rif-treated RNase E cells, and on 195 WT and 239 rif-treated ribosome cells.
Fig. 4.
Fig. 4.
Cell cycle-dependent spatial distribution of RNase E-eYFP in fixed Caulobacter cells. (AE) SR reconstructions of fixed Caulobacter cells expressing RNase E-eYFP and PAmCherry-PopZ at (A) 5 min, (B) 35 min, (C) 65 min, (D) 95 min, and (E) 125 min after synchrony. The total cell cycle is 150 min. Cells are on 1-μm grids. (F) Distributions of the number of molecules detected in each RNase E cluster throughout the cell cycle. (G) Distributions of the number of RNase E clusters per cell throughout the cell cycle. We find a constant number of molecules in each cluster for all cell stages, but a doubling in the number of clusters per cell during the swarmer to stalk transition.
Fig. 5.
Fig. 5.
Colocalization of rRNA loci and CCNA_01879 loci with RNase E. (A) A cartoon of the labeled DNA loci. Approximate locations were calculated using the Caulobacter swarmer 1D chromosome map as described previously (32). (B) A schematic of the DNA-labeling scheme. (C, Left) A white-light (WL) image of live Caulobacter cells expressing RNase E-PAmCherry and tetR-eYFP/85x-tetO on rDNA1 locus. (C, Middle) A diffraction-limited (DL) image of the tetR-eYFP labeling the rDNA1 locus. (C, Right) A DL image of RNase E-PAmCherry. In total, 79.2% of rDNA1 locus (cyan) colocalizes with an RNase E cluster (yellow). (D) Caulobacter cells with rDNA2 labeled. In total, 76.9% of rDNA2 locus (red) colocalizes with an RNase E cluster (yellow). (E) Caulobacter cell with CCNA_01879 labeled. In total, 27.1% of the control CCNA_01879 locus (green) colocalizes with an RNase E cluster. (Scale bars: 500 nm.) Analysis was performed on 506 rDNA1 cells, 664 rDNA2 cells, and 321 control cells.

References

    1. Mackie GA. RNase E: At the interface of bacterial RNA processing and decay. Nat Rev Microbiol. 2013;11:45–57. - PubMed
    1. Hardwick SW, Chan VSY, Broadhurst RW, Luisi BF. An RNA degradosome assembly in Caulobacter crescentus. Nucleic Acids Res. 2011;39:1449–1459. - PMC - PubMed
    1. Strahl H, et al. Membrane recognition and dynamics of the RNA degradosome. PLoS Genet. 2015;11:e1004961. - PMC - PubMed
    1. Moffitt JR, Pandey S, Boettiger AN, Wang S, Zhuang X. Spatial organization shapes the turnover of a bacterial transcriptome. eLife. 2016;5:e13065. - PMC - PubMed
    1. Fei J, et al. RNA biochemistry. Determination of in vivo target search kinetics of regulatory noncoding RNA. Science. 2015;347:1371–1374. - PMC - PubMed

Publication types

MeSH terms

LinkOut - more resources