. 2018 May 13;376(2119):20160452.
doi: 10.1098/rsta.2016.0452.

Changes in climate extremes, fresh water availability and vulnerability to food insecurity projected at 1.5°C and 2°C global warming with a higher-resolution global climate model

Affiliations

Changes in climate extremes, fresh water availability and vulnerability to food insecurity projected at 1.5°C and 2°C global warming with a higher-resolution global climate model

Richard A Betts et al. Philos Trans A Math Phys Eng Sci. .

Abstract

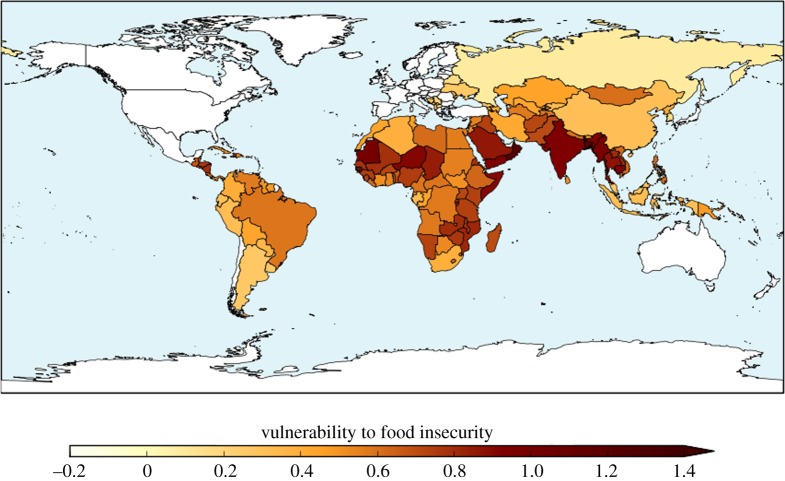
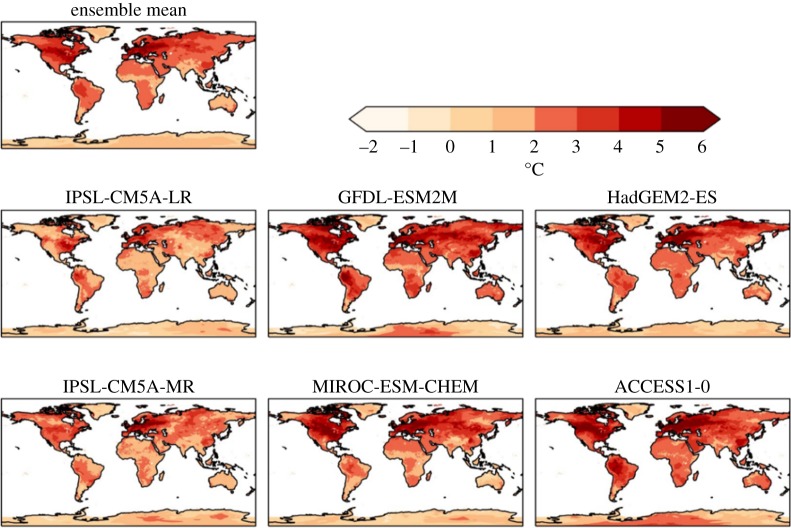
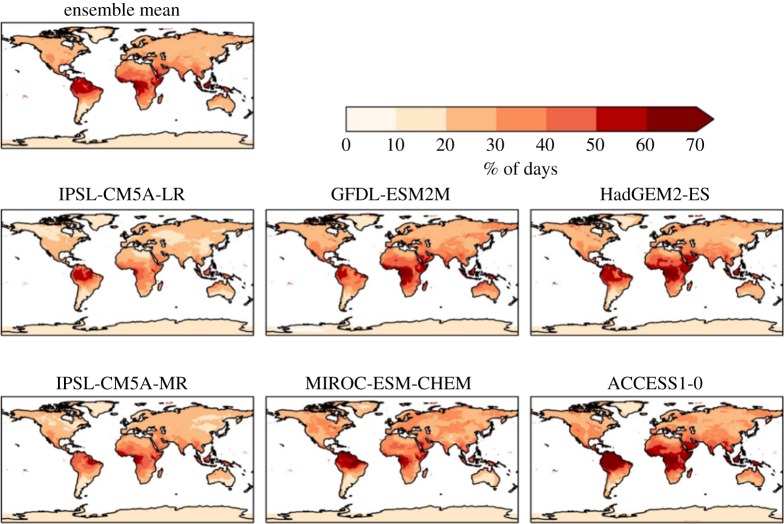
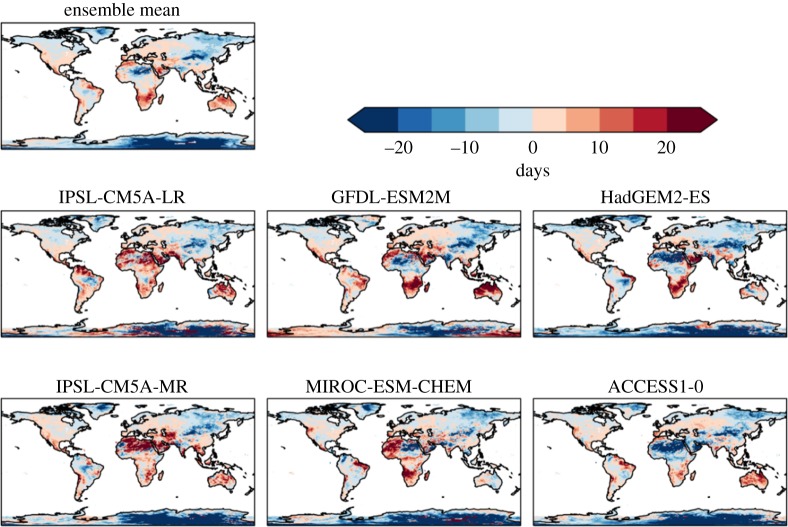
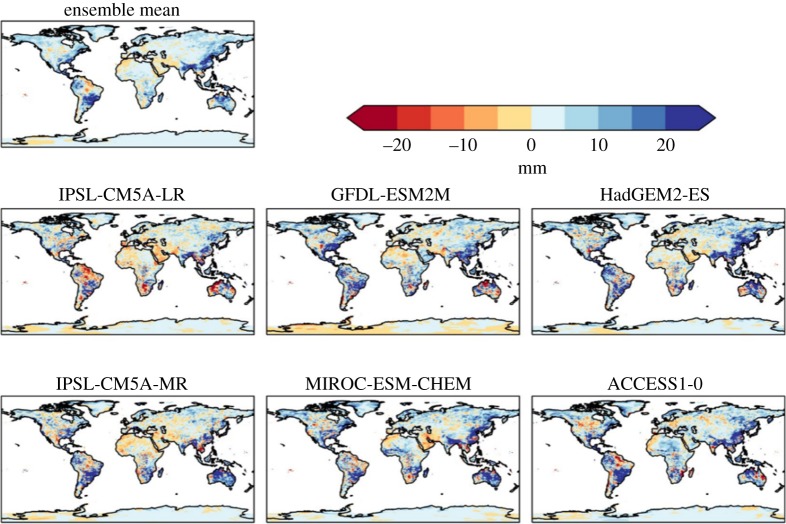
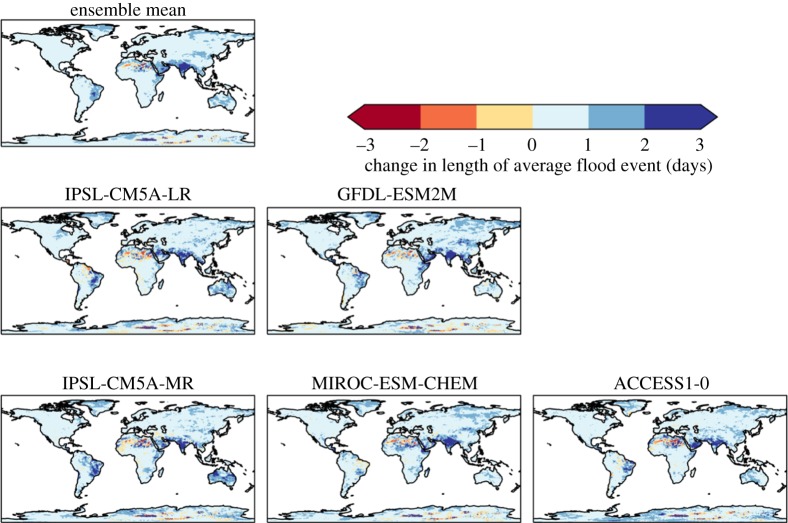
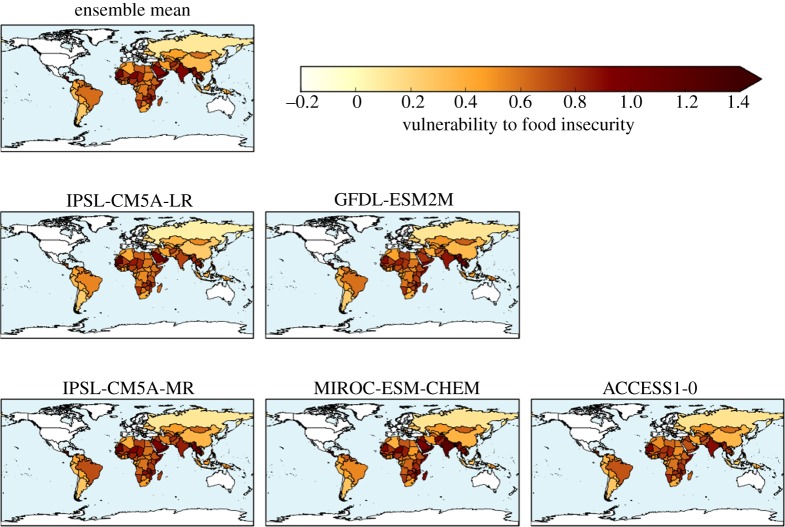
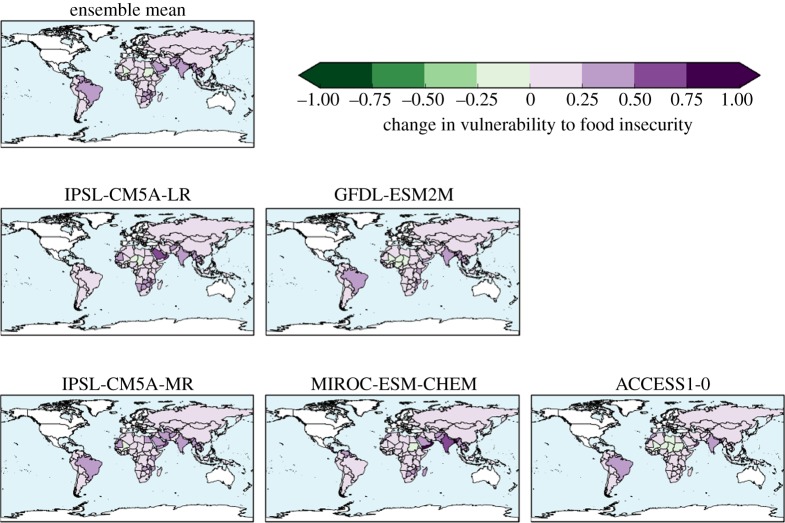
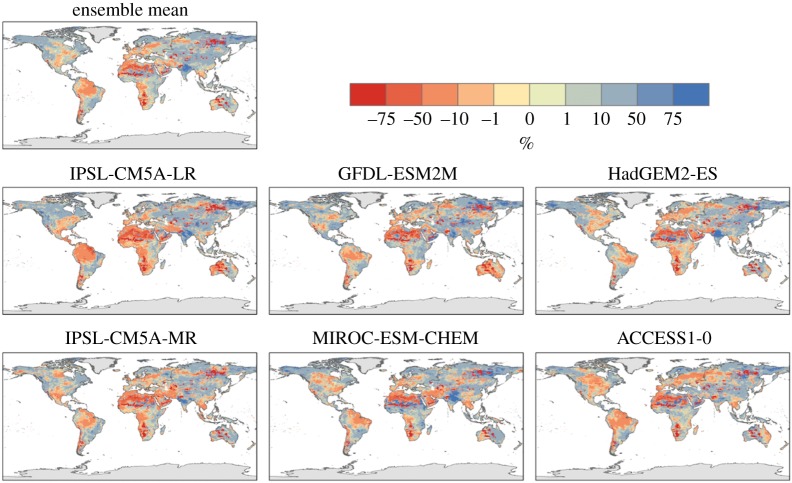
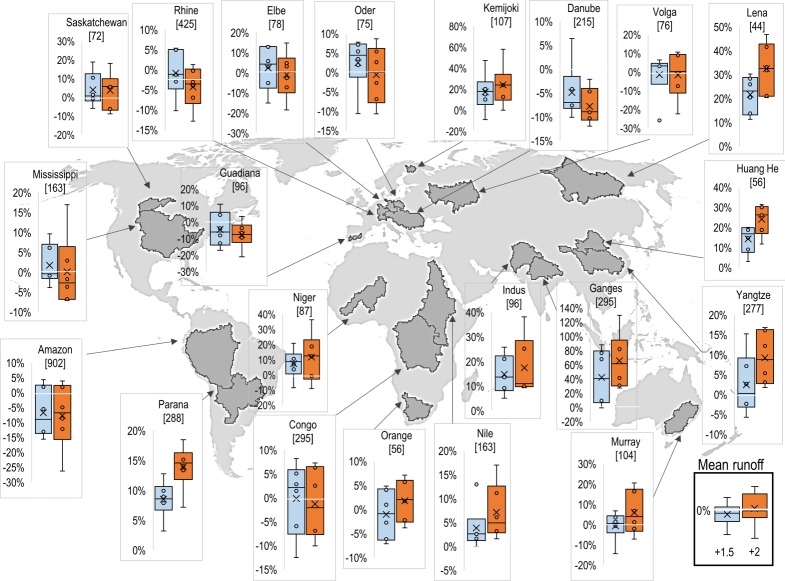
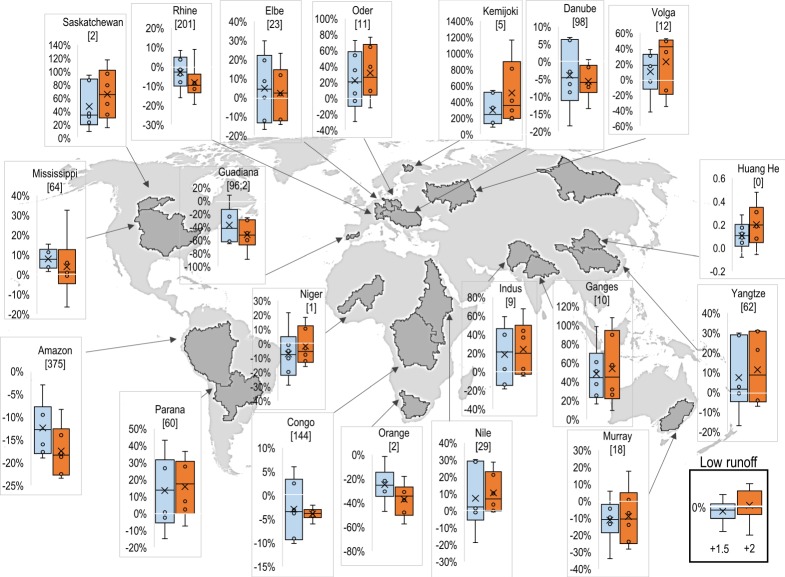
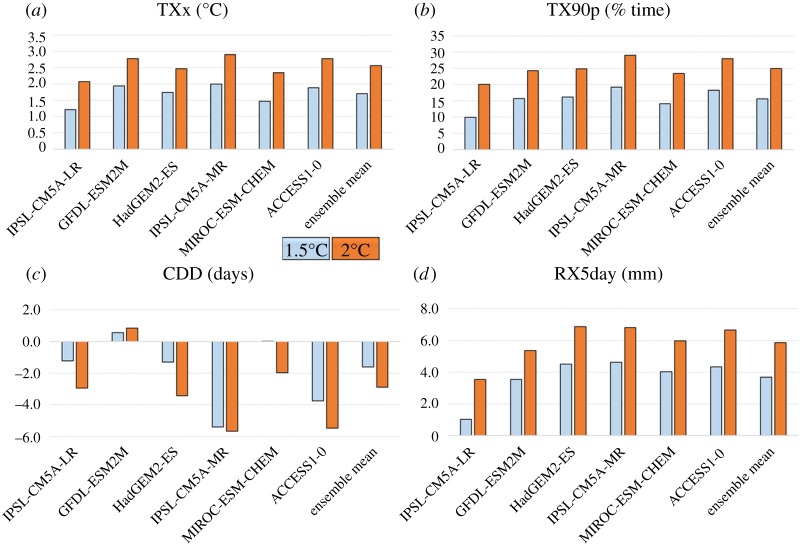
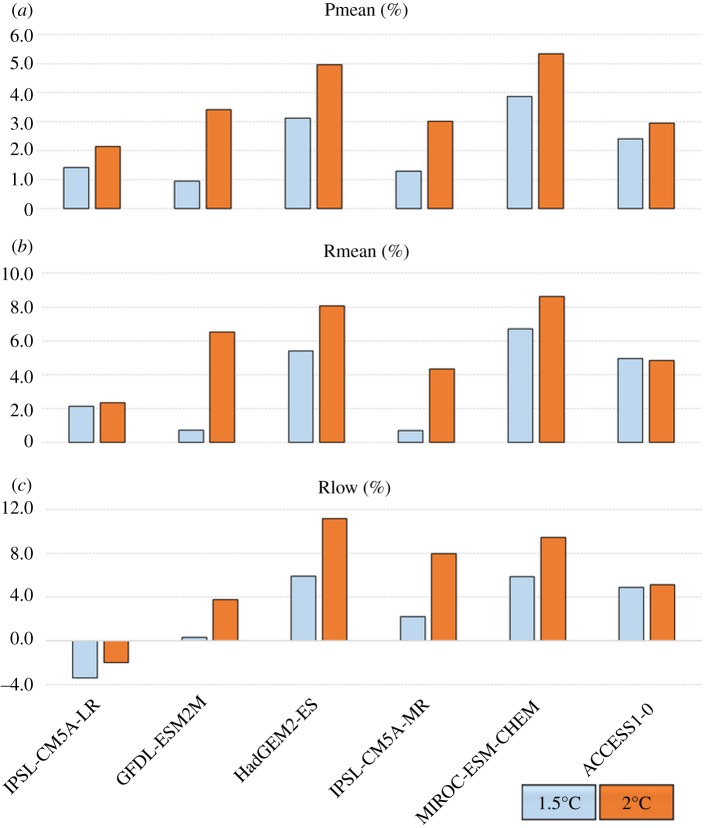
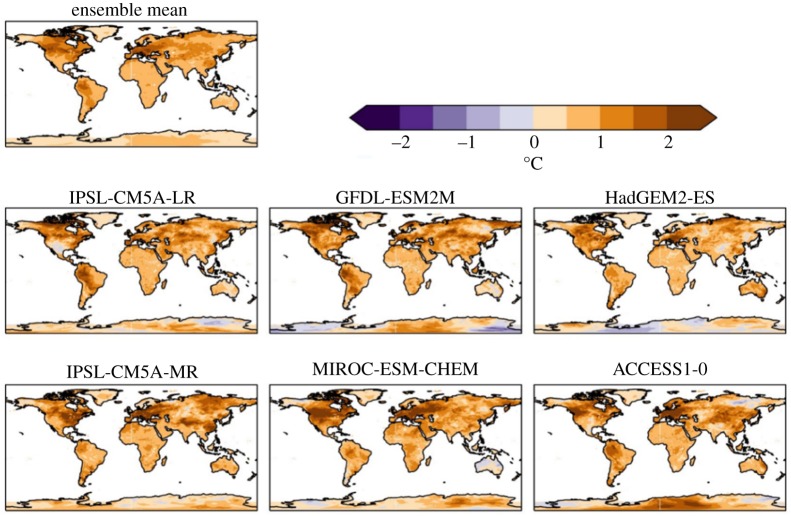
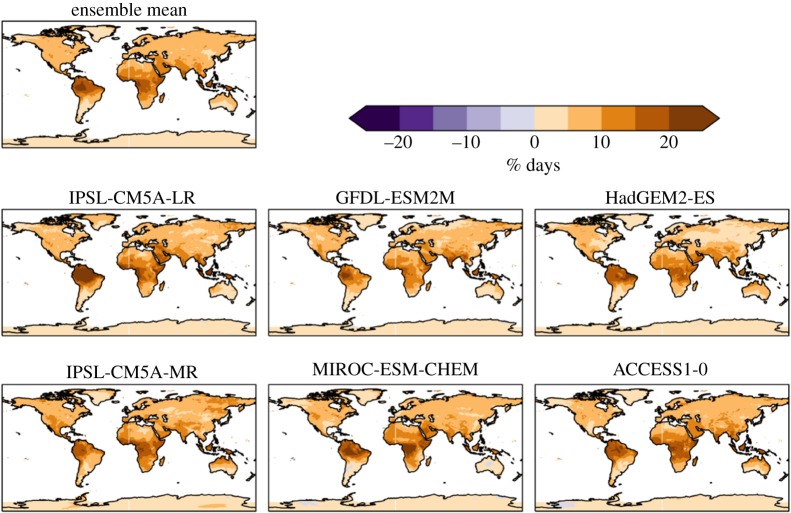
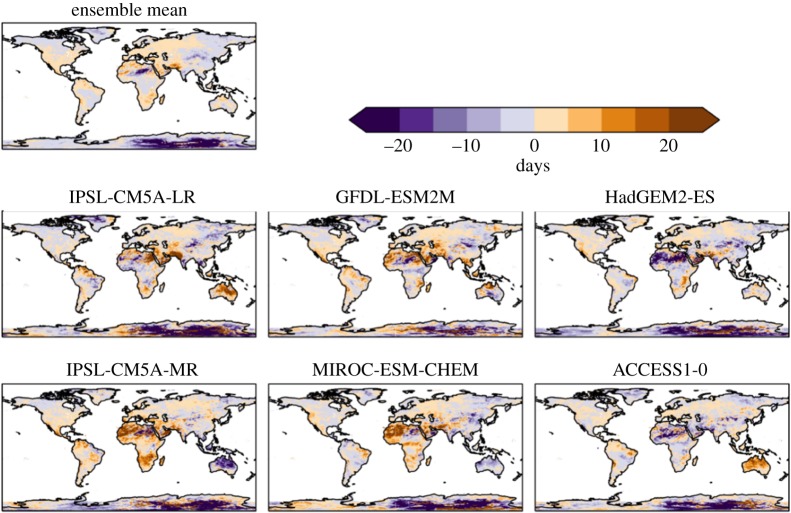
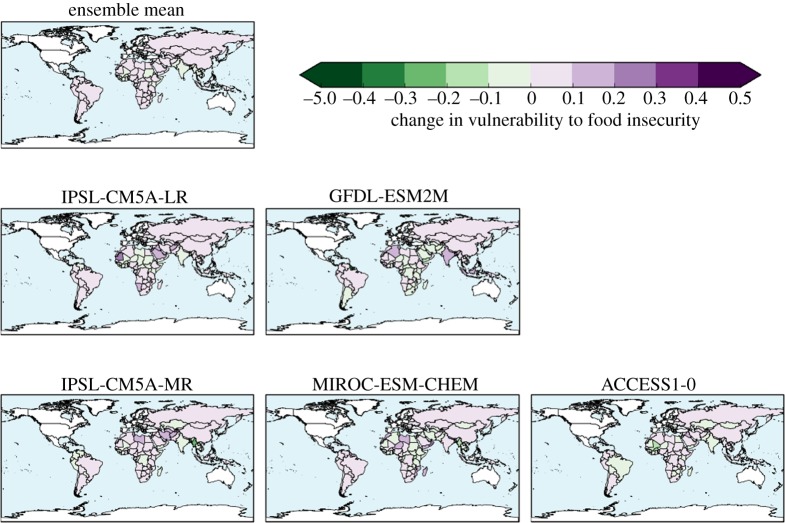
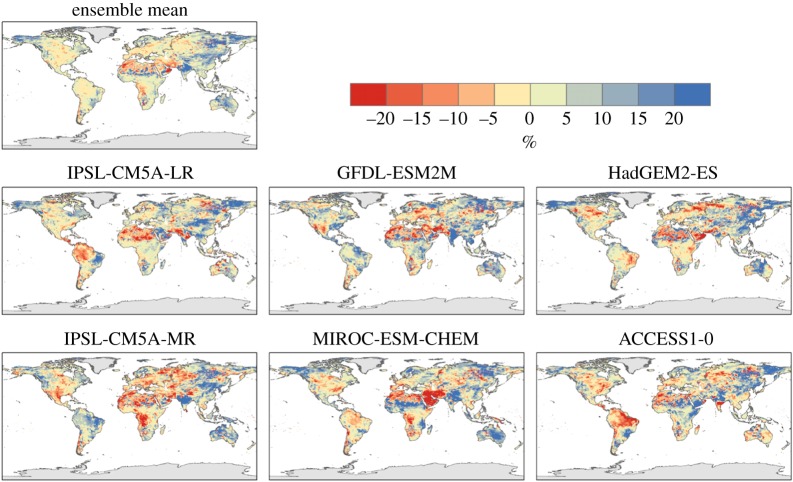
We projected changes in weather extremes, hydrological impacts and vulnerability to food insecurity at global warming of 1.5°C and 2°C relative to pre-industrial, using a new global atmospheric general circulation model HadGEM3A-GA3.0 driven by patterns of sea-surface temperatures and sea ice from selected members of the 5th Coupled Model Intercomparison Project (CMIP5) ensemble, forced with the RCP8.5 concentration scenario. To provide more detailed representations of climate processes and impacts, the spatial resolution was N216 (approx. 60 km grid length in mid-latitudes), a higher resolution than the CMIP5 models. We used a set of impacts-relevant indices and a global land surface model to examine the projected changes in weather extremes and their implications for freshwater availability and vulnerability to food insecurity. Uncertainties in regional climate responses are assessed, examining ranges of outcomes in impacts to inform risk assessments. Despite some degree of inconsistency between components of the study due to the need to correct for systematic biases in some aspects, the outcomes from different ensemble members could be compared for several different indicators. The projections for weather extremes indices and biophysical impacts quantities support expectations that the magnitude of change is generally larger for 2°C global warming than 1.5°C. Hot extremes become even hotter, with increases being more intense than seen in CMIP5 projections. Precipitation-related extremes show more geographical variation with some increases and some decreases in both heavy precipitation and drought. There are substantial regional uncertainties in hydrological impacts at local scales due to different climate models producing different outcomes. Nevertheless, hydrological impacts generally point towards wetter conditions on average, with increased mean river flows, longer heavy rainfall events, particularly in South and East Asia with the most extreme projections suggesting more than a doubling of flows in the Ganges at 2°C global warming. Some areas are projected to experience shorter meteorological drought events and less severe low flows, although longer droughts and/or decreases in low flows are projected in many other areas, particularly southern Africa and South America. Flows in the Amazon are projected to decline by up to 25%. Increases in either heavy rainfall or drought events imply increased vulnerability to food insecurity, but if global warming is limited to 1.5°C, this vulnerability is projected to remain smaller than at 2°C global warming in approximately 76% of developing countries. At 2°C, four countries are projected to reach unprecedented levels of vulnerability to food insecurity.This article is part of the theme issue 'The Paris Agreement: understanding the physical and social challenges for a warming world of 1.5°C above pre-industrial levels'.

Keywords: 1.5°C; 2°C; Paris Agreement; global climate impacts; terrestrial ecosystems; water resources.


Conflict of interest statement

We declare we have no competing interests.

Figures

Figure 1.
Figure 1.
Hunger and Climate Vulnerability Index for 1981–2010 climate (ensemble mean across the bias-corrected HadGEM3 ensemble).
Figure 2.
Figure 2.
Simulated changes in annual daily maximum temperature relative to 1981–2010 at 2°C global warming, for individual HadGEM3 simulations driven by SSTs and SICs from different members of the CMIP5 ensemble, and the ensemble mean. The labels above each panel identify the driving CMIP5 model (or ensemble mean).
Figure 3.
Figure 3.
Simulated changes in the percentage of days with daily temperature above the 90th percentile for 1981–2010 at 2°C global warming, for individual HadGEM3 simulations driven by SSTs and SICs from different members of the CMIP5 ensemble, and the ensemble mean. The labels above each panel identify the driving CMIP5 model (or ensemble mean).
Figure 4.
Figure 4.
Simulated changes in the number of consecutive dry days relative to 1981–2010, at 2°C global warming, for individual HadGEM3 simulations driven by SSTs and SICs from different members of the CMIP5 ensemble, and the ensemble mean. The labels above each panel identify the driving CMIP5 model (or ensemble mean).
Figure 5.
Figure 5.
Simulated changes in the annual maximum rainfall over 5 days relative to 1981–2010, at 2°C global warming, for individual HadGEM3 simulations driven by SSTs and SICs from different members of the CMIP5 ensemble, and the ensemble mean. The labels above each panel identify the driving CMIP5 model (or ensemble mean).
Figure 6.
Figure 6.
Simulated changes in the average length of flood events (number of days in which the cumulative daily rainfall excess is positive, compared with the 95th percentile in 1981–2010, at 2°C global warming, for individual HadGEM3 simulations driven by SSTs and SICs from different members of the CMIP5 ensemble, and the ensemble mean. The labels above each panel identify the driving CMIP5 model (or ensemble mean).
Figure 7.
Figure 7.
Hunger and Climate Vulnerability Index calculated for simulated climate states at 2°C global warming for five individual HadGEM3 simulations driven by SSTs and SICs from different members of the CMIP5 ensemble, and the ensemble mean.
Figure 8.
Figure 8.
Change in Hunger and Climate Vulnerability Index relative to baseline calculated for simulated climate states at 2°C global warming, for five individual HadGEM3 simulations driven by SSTs and SICs from different members of the CMIP5 ensemble, and the ensemble mean.
Figure 9.
Figure 9.
Changes in run-off for mean flows simulated by the JULES ecosystem–hydrology model under six climate simulations at 2°C global warming. (a) Ensemble mean and (b) percentage of models agreeing on increased flow.
Figure 10.
Figure 10.
Distributions of changes in run-off for mean flows simulated by the JULES ecosystem–hydrology model under the ensemble of six climate projections at 1.5°C (blue) and 2°C (orange) global warming. Boxes show the 25th and 75th percentile changes, whiskers show the range, circles show the four projections that do not define the ends of the range, and crosses show the ensemble means. Numbers in square brackets show the ensemble-mean flow in the baseline, in millimetres of rain equivalent.
Figure 11.
Figure 11.
Distributions of changes in run-off for low flows (flows for lowest 10% of time) simulated by the JULES ecosystem–hydrology model under the ensemble of six climate projections at 1.5°C (blue) and 2°C (orange) global warming. Boxes show the 25th and 75th percentile changes, whiskers show the range, circles show the four projections that do not define the ends of the range, and crosses show the ensemble means. Numbers in square brackets show the ensemble-mean flow in the baseline, in millimetres of rain equivalent.
Figure 12.
Figure 12.
Comparison of global mean changes in climate extremes indices relative to 1981–2010 at 2°C and 1.5°C global warming for individual ensemble members and ensemble mean. (a) Change in annual daily maximum temperature; (b) percentage of days with maximum temperature above 90th percentile for 1981–2010; (c) change in consecutive dry days; (d) change in annual maximum 5-day rainfall.
Figure 13.
Figure 13.
Global mean percentage changes relative to 1981–2010 in (a) precipitation over land, (b) mean run-off flows, (c) low run-off lows (10th percentile), at 2°C and 1.5°C global warming.
Figure 14.
Figure 14.
Difference in annual maximum daily maximum temperature between 2°C and 1.5°C global warming, for individual ensemble members and ensemble mean.
Figure 15.
Figure 15.
Difference between 2°C and 1.5°C global warming for percentage of days with maximum temperature above 90th percentile of baseline, for individual ensemble members and ensemble mean.
Figure 16.
Figure 16.
Difference in consecutive dry days between 2°C and 1.5°C global warming, for individual ensemble members and ensemble mean.
Figure 17.
Figure 17.
Difference in annual maximum 5 day rainfall between 2°C and 1.5°C global warming, for individual ensemble members and ensemble mean.
Figure 18.
Figure 18.
Hunger and Climate Vulnerability Index at 1.5°C global warming (ensemble mean).
Figure 19.
Figure 19.
Difference in Hunger and Climate Vulnerability Index between 2°C and 1.5°C global warming, for individual ensemble members and ensemble mean.
Figure 20.
Figure 20.
Difference between 2°C and 1.5°C global warming in percentage changes in mean (top) run-off in JULES simulations driven by the ensemble of HadGEM3 simulations. Note that the use of percentage changes emphasizes changes in regions where the baseline streamflow is small.

References

    1. IPCC. 2014. Summary for policymakers. In Climate change 2014: impacts, adaptation, and vulnerability. Part A: global and sectoral aspects. Contribution of Working Group II to the Fifth Assessment Report of the Intergovernmental Panel on Climate Change (eds Field CB. et al), pp. 1–32. Cambridge, UK: Cambridge University Press.
    1. Murphy JM, et al. 2009. UK climate projections science report: climate change projections. Exeter, UK: Met Office Hadley Centre; See http://ukclimateprojections.metoffice.gov.uk.
    1. United Nations. 2010. Report of the Conference Parties on its fifteenth session, held in Copenhagen, 7 to 19 December 2009 Addendum. Part Two: Action taken by the Conference of the Parties at its fifteenth session. See http://unfccc.int/resource/docs/2009/cop15/eng/11a01.pdf.
    1. United Nations. 2016. Report of the Conference Parties on its twenty-first session, held in Paris, 30 November to 13 December 2015 Addendum Part two: Action taken by the Conference of the Parties at its twenty-first session. See http://unfccc.int/resource/docs/2015/cop21/eng/10a01.pdf.
    1. Hewitson B, et al. 2014. Regional context. In Climate change 2014: impacts, adaptation, and vulnerability. Part B: regional aspects. Contribution of Working Group II to the Fifth assessment report of the Intergovernmental Panel on Climate Change (eds Barros VR, et al.), pp. 1133–1197. Cambridge, UK: Cambridge University Press.

LinkOut - more resources