. 2018 May 13;376(2119):20160454.
doi: 10.1098/rsta.2016.0454.

Solar geoengineering as part of an overall strategy for meeting the 1.5°C Paris target

Affiliations

Solar geoengineering as part of an overall strategy for meeting the 1.5°C Paris target

Douglas G MacMartin et al. Philos Trans A Math Phys Eng Sci. .

Abstract

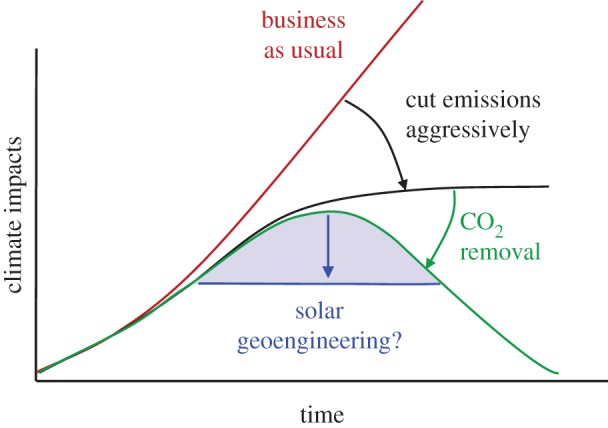
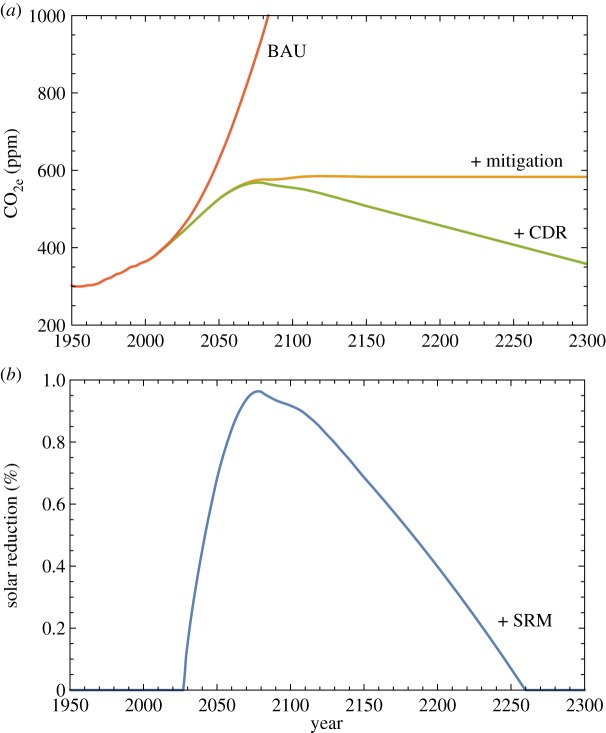
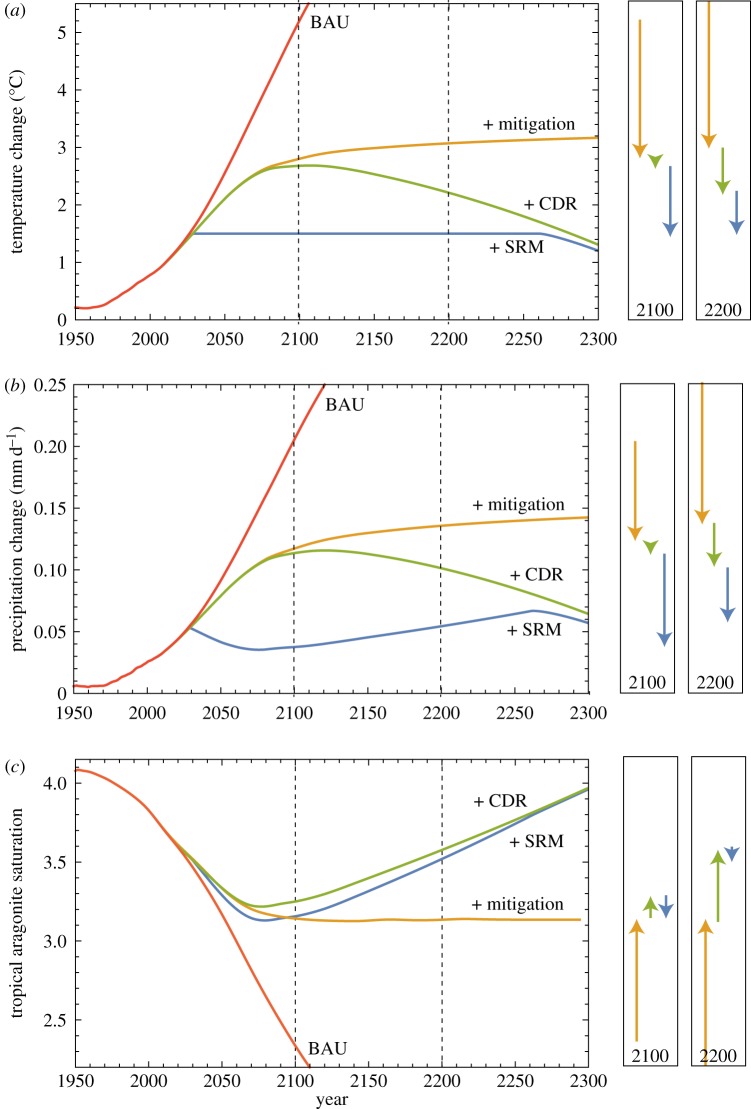
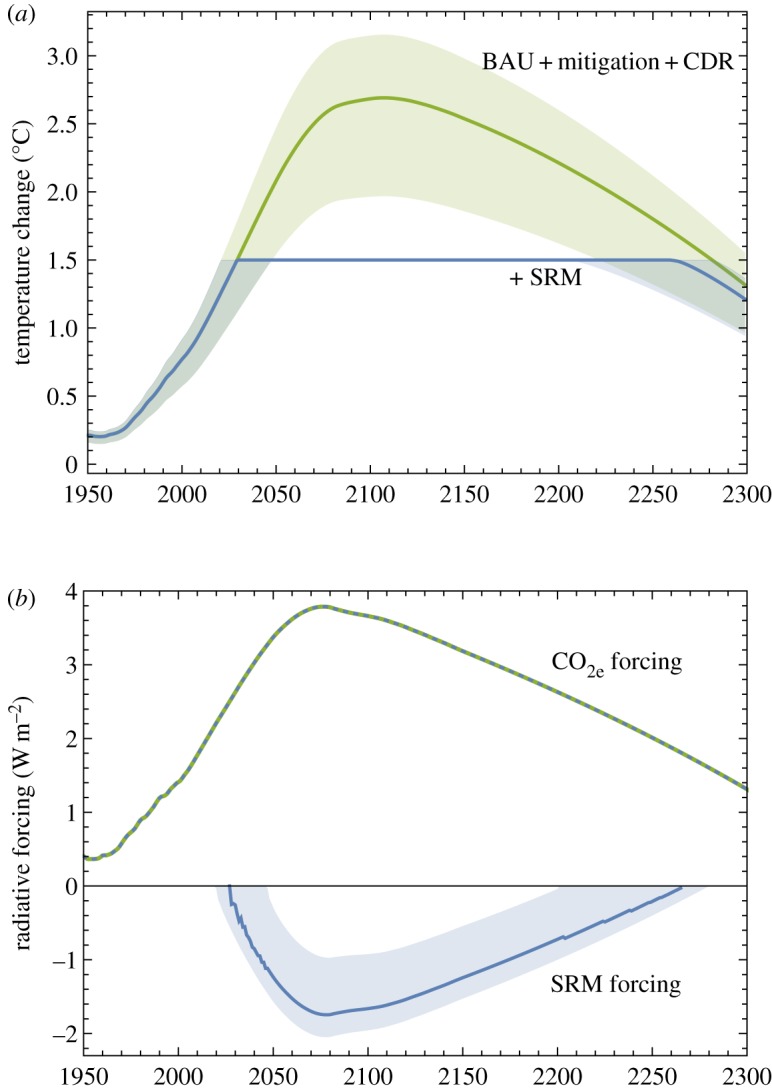
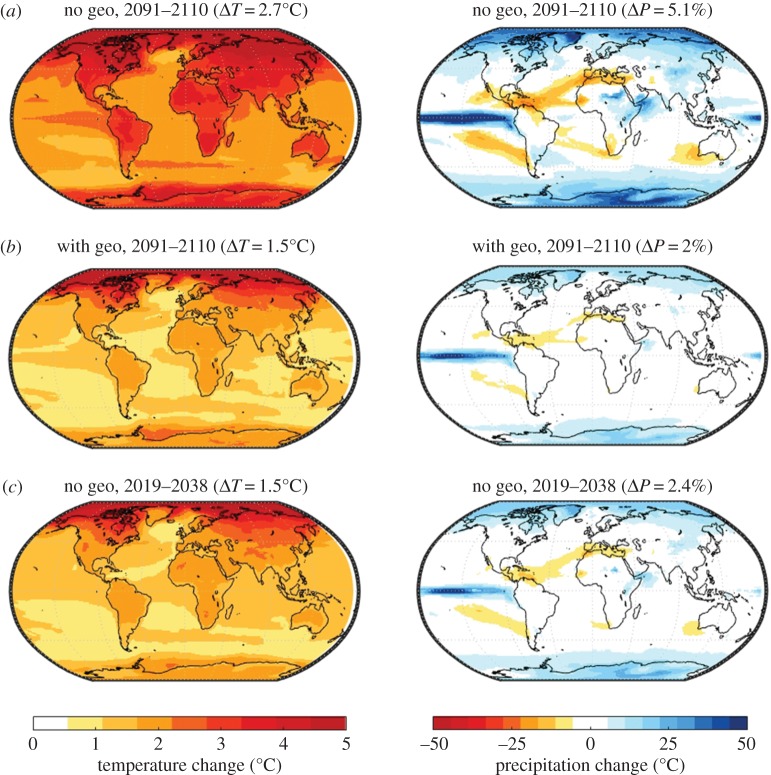
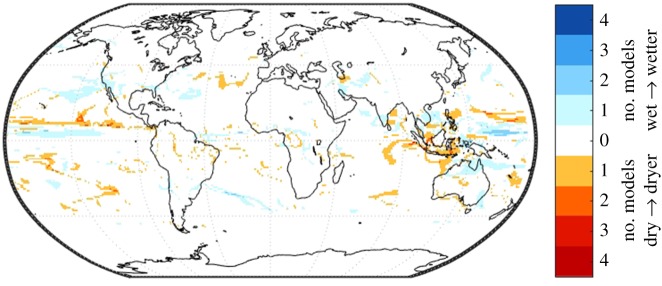
Solar geoengineering refers to deliberately reducing net radiative forcing by reflecting some sunlight back to space, in order to reduce anthropogenic climate changes; a possible such approach would be adding aerosols to the stratosphere. If future mitigation proves insufficient to limit the rise in global mean temperature to less than 1.5°C above preindustrial, it is plausible that some additional and limited deployment of solar geoengineering could reduce climate damages. That is, these approaches could eventually be considered as part of an overall strategy to manage the risks of climate change, combining emissions reduction, net-negative emissions technologies and solar geoengineering to meet climate goals. We first provide a physical-science review of current research, research trends and some of the key gaps in knowledge that would need to be addressed to support informed decisions. Next, since few climate model simulations have considered these limited-deployment scenarios, we synthesize prior results to assess the projected response if solar geoengineering were used to limit global mean temperature to 1.5°C above preindustrial in an overshoot scenario that would otherwise peak near 3°C. While there are some important differences, the resulting climate is closer in many respects to a climate where the 1.5°C target is achieved through mitigation alone than either is to the 3°C climate with no geoengineering. This holds for both regional temperature and precipitation changes; indeed, there are no regions where a majority of models project that this moderate level of geoengineering would produce a statistically significant shift in precipitation further away from preindustrial levels.This article is part of the theme issue 'The Paris Agreement: understanding the physical and social challenges for a warming world of 1.5°C above pre-industrial levels'.

Keywords: 1.5; climate change; geoengineering.


Conflict of interest statement

We declare we have no competing interests.

Figures

Figure 1.
Figure 1.
Reducing greenhouse gas emissions, combined with future large-scale atmospheric CO2 removal (CDR), may lead to long-term climate stabilization, but with some potentially significant overshoot of desired temperature targets. There is thus a possible role for limited and temporary solar geoengineering as part of an overall strategy to reduce climate impacts during the overshoot period. (Solar geoengineering as an alternative to mitigation would require extremely large forcing to be sustained for millennia, and is thus not necessarily realistic or advisable.) This graph, adapted from [10], represents climate impacts conceptually, not quantitatively; see figure 3 for a specific representative scenario. (Online version in colour.)
Figure 2.
Figure 2.
Representative scenarios used in figures 3–6. (a) CO2-equivalent (CO2e) for representative concentration pathway RCP8.5 (representing a business-as-usual (BAU) scenario), RCP4.5 (to represent mitigation) and RCP4.5 augmented with significant levels of long-term CO2 removal (+CDR) sufficient to reduce concentrations by 1 ppm yr−1. The solar reduction (+ SRM) used in figure 3 is shown in b. For simplicity, the carbon-cycle feedbacks between the reduced temperatures associated with using solar geoengineering and resulting CO2 concentrations is ignored. (Online version in colour.)
Figure 3.
Figure 3.
Not all climate variables respond to solar geoengineering the same way. The global-mean temperature (a), global mean precipitation (b) and tropical aragonite saturation state (c) are shown for the cases in figure 2: RCP8.5 (BAU), RCP4.5 (+mitigation), RCP4.5 augmented with long-term CO2 removal (+CDR) and RCP4.5, CDR, and sufficient solar geoengineering to maintain temperature at 1.5°C (+SRM). SRM acts quickly while CDR acts slowly: in this scenario, the compensation of climate change due to CO2 emissions is primarily due to SRM in 2100; by 2200 both SRM and CDR contribute. Temperature and precipitation responses are estimated from median of 12 models participating in GeoMIP and aragonite saturation state responses are estimated from Kwiatkowski et al. [94] (see appendix A; the electronic supplementary material). (Online version in colour.)
Figure 4.
Figure 4.
Uncertainty in climate sensitivity results in a range of temperature outcomes for a given CO2-concentration pathway; the multi-model median response and range across the 12 models considered here is shown for the case with long-term CO2 removal both with and without solar geoengineering. (a) Solar geoengineering could be used to achievea 1.5°C target independent of climate sensitivity uncertainty. (b) The range of forcing from solar geoengineering across the 12 models and from CO2e; analysis uses % solar reduction and concentration, respectively, but these are plotted as approximate radiative forcing to enable comparison between them. CO2 forcing is estimated as 5.35 times the log of the concentration change. Because of the short timescales associated with solar geoengineering, uncertainty in climate response can be compensated for with control over solar geoengineering forcing. (Online version in colour.)
Figure 5.
Figure 5.
Projected temperature and precipitation changes relative to preindustrial for the scenarios in figure 2; end-of-century response without (a) and with (b) geoengineering, and for comparison the warming from 2019–2038 (c) where the global mean temperature change is 1.5°C without geoengineering. Each panel also lists the global-mean change in temperature or the % change in precipitation. Median results are shown over 12 climate models participating in GeoMIP, estimated using a dynamic climate emulator (see appendix A).
Figure 6.
Figure 6.
Number of models considered here (out of 12) where projected end-of-century precipitation is both further from preindustrial with geoengineering than it is without, and where the change is statistically significant over a 20-year period (consistent with the averaging time in figure 5). For temperature, every model is closer to preindustrial everywhere.

Similar articles

Cited by

References

    1. UNFCCC. 2015. Adoption of the Paris Agreement. See https://unfccc.int/resource/docs/2015/cop21/eng/l09.pdf.
    1. Rogelj J, Luderer G, Pietzcker RC, Kriegler E, Schaeffer M, Krey V, Riahi K. 2015. Energy system transformations for limiting end-of-century warming to below 1.5°C. Nat. Clim. Change 5, 519–527. (10.1038/nclimate2572) - DOI
    1. Sanderson B, O’Neill B, Tebaldi C. 2016. What would it take to achieve the Paris temperature targets? Geophys. Res. Lett. 43, 7133–7142. (10.1002/2016GL069563) - DOI
    1. Rogelj J. et al. 2016. Paris Agreement climate proposals need a boost to keep warming well below 2°C. Nature 534, 631–639. (10.1038/nature18307) - DOI - PubMed
    1. National Academy of Sciences. 2015. Climate intervention: carbon dioxide removal and reliable sequestration. Washington DC: The National Academies Press.