. 2018 Apr;50(4):493-497.
doi: 10.1038/s41588-018-0089-9. Epub 2018 Apr 2.

Single-cell RNA sequencing identifies celltype-specific cis-eQTLs and co-expression QTLs

Affiliations

Single-cell RNA sequencing identifies celltype-specific cis-eQTLs and co-expression QTLs

Monique G P van der Wijst et al. Nat Genet. 2018 Apr.

Abstract

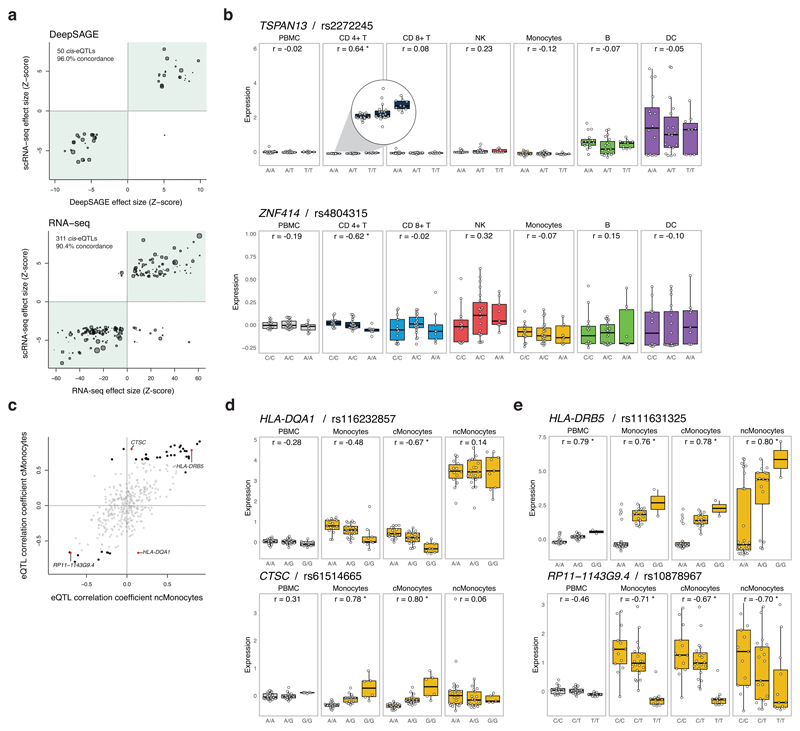
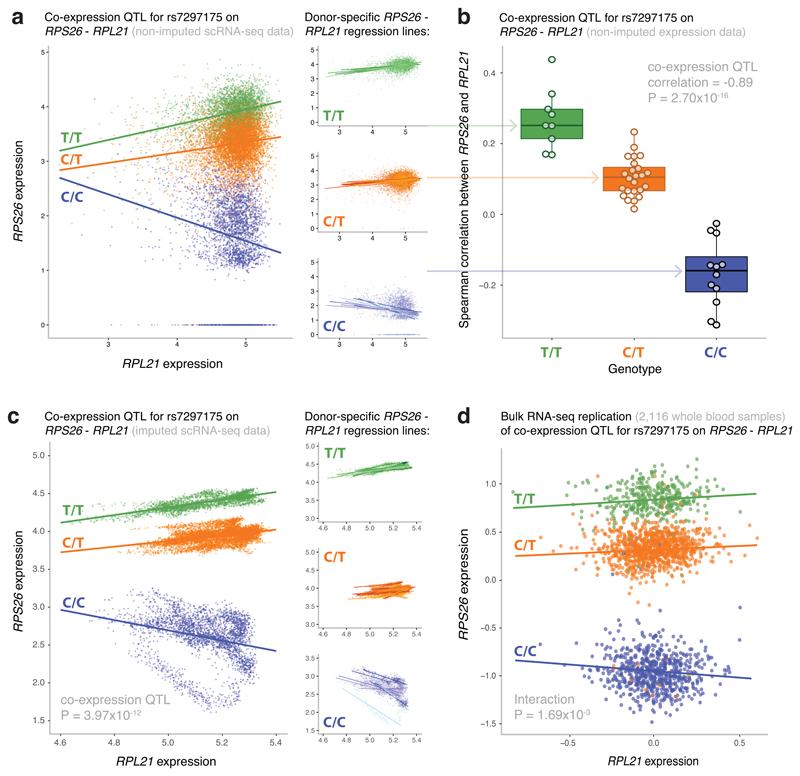
Genome-wide association studies have identified thousands of genetic variants that are associated with disease 1 . Most of these variants have small effect sizes, but their downstream expression effects, so-called expression quantitative trait loci (eQTLs), are often large 2 and celltype-specific3-5. To identify these celltype-specific eQTLs using an unbiased approach, we used single-cell RNA sequencing to generate expression profiles of ~25,000 peripheral blood mononuclear cells from 45 donors. We identified previously reported cis-eQTLs, but also identified new celltype-specific cis-eQTLs. Finally, we generated personalized co-expression networks and identified genetic variants that significantly alter co-expression relationships (which we termed 'co-expression QTLs'). Single-cell eQTL analysis thus allows for the identification of genetic variants that impact regulatory networks.


Conflict of interest statement

Competing financial interests

The authors declare no competing financial interests.

Figures

Figure 1
Figure 1. Cis-eQTL analysis in single-cell RNA-seq data.
(a) Effect size of the cis-eQTLs detected in the bulk-like PBMC scRNA-seq sample in which the analysis was confined to previously reported cis-eQTLs in (top) whole blood DeepSAGE or (bottom) bulk RNA-seq data. The number and percentage represent, respectively, the detected cis-eQTLs and their concordance (i.e. same allelic direction – green quadrants) between the bulk-like PBMC population scRNA-seq eQTLs and (top) whole blood DeepSAGE or (bottom) bulk RNA-seq data. The size of each dot represents the mean expression of the cis-regulated gene in the total scRNA-seq dataset. (b) Examples of undetectable cis-eQTLs in the bulk-like PBMC population caused by (top) masking of the cis-eQTL present in CD4+ T cells but absent in DCs with comparatively high expression of the cis-regulated gene or (bottom) opposite allelic effects in CD4+ T and NK cells. (c) Spearman’s rank correlation coefficient for the cMonocytes against the ncMonocytes of all top eQTLs that were identified in the total dataset or at least one (sub)cell cluster (see Suppl. Table 2). Significant correlations are shown in black (four red highlighted examples are shown in d and e), the non-significant in gray. (d) Cis-eQTLs specifically affecting expression in the cMonocytes, and not the ncMonocytes. (e) Cis-eQTLs significantly affecting the expression in both the cMonocytes and ncMonocytes. Each dot represents the mean expression of the eQTL gene in a donor. Box plots show the median, the first and third quartiles, and 1.5 times the interquartile range. r, Spearman’s rank correlation coefficient; *FDR≤0.05.
Figure 2
Figure 2. Most significant co-expression QTL in the CD4+ T cells.
(a) The non-imputed expression of RPS26 and RPL21 of all individual CD4+ T cells colored by genotype (left panel) and stratified per SNP rs7297175 genotype (right panels). Genotype- and donor-specific regression lines are shown in the left and right panel, respectively. Each data point represents a single cell. The nominal P-value is given for the co-expression QTL. (b) The Spearman’s rank correlation coefficient (r) between RPS26 and RPL21 expression stratified by SNP rs7297175 genotype in the CD4+ T cells per donor. Each data point represents a single donor. Box plots show the median, the first and third quartiles, and 1.5 times the interquartile range. The nominal P-value is given for the co-expression QTL. (c) The imputed expression of RPS26 and RPL21 of all individual CD4+ T cells colored by genotype (left panel) and stratified per SNP rs7297175 genotype (right panels). Genotype- and donor-specific regression lines are shown in the left and right panel, respectively. Each data point represents a single cell. (d) The expression of RPS26 and RPL21 of whole blood bulk RNA-seq samples colored by SNP rs7297175 genotype. Genotype-specific regression lines are shown. Each data point represents a single bulk RNA-seq sample. The nominal P-value is given for the interaction effect.

References

    1. Visscher PM, Brown MA, McCarthy MI, Yang J. Five years of GWAS discovery. Am J Hum Genet. 2012;90:7–24. - PMC - PubMed
    1. Westra HJ, et al. Systematic identification of trans eQTLs as putative drivers of known disease associations. Nat Genet. 2013;45:1238–1243. - PMC - PubMed
    1. Brown CD, Mangravite LM, Engelhardt BE. Integrative modeling of eQTLs and cis-regulatory elements suggests mechanisms underlying cell type specificity of eQTLs. PLoS Genet. 2013;9:e1003649. - PMC - PubMed
    1. Fairfax BP, et al. Genetics of gene expression in primary immune cells identifies cell type-specific master regulators and roles of HLA alleles. Nat Genet. 2012;44:502–510. - PMC - PubMed
    1. Fu J, et al. Unraveling the regulatory mechanisms underlying tissue-dependent genetic variation of gene expression. PLoS Genet. 2012;8:e1002431. - PMC - PubMed

Publication types