. 2018 Apr;50(4):613-620.
doi: 10.1038/s41588-018-0091-2. Epub 2018 Apr 2.

A global transcriptional network connecting noncoding mutations to changes in tumor gene expression

Affiliations

A global transcriptional network connecting noncoding mutations to changes in tumor gene expression

Wei Zhang et al. Nat Genet. 2018 Apr.

Abstract

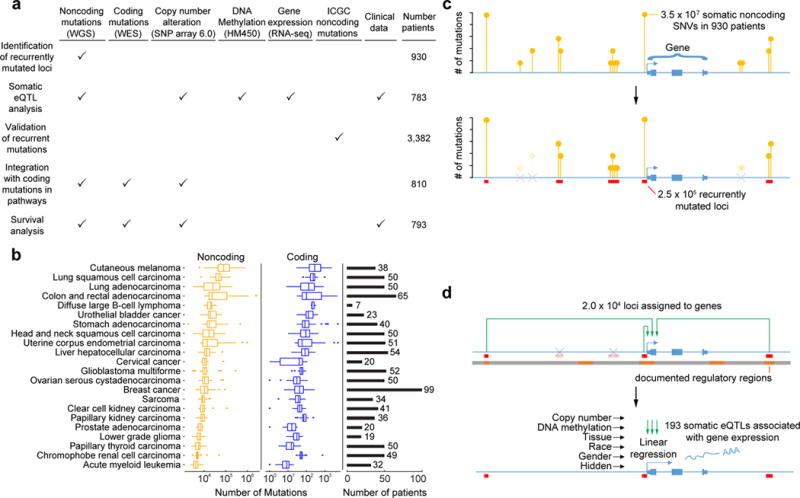
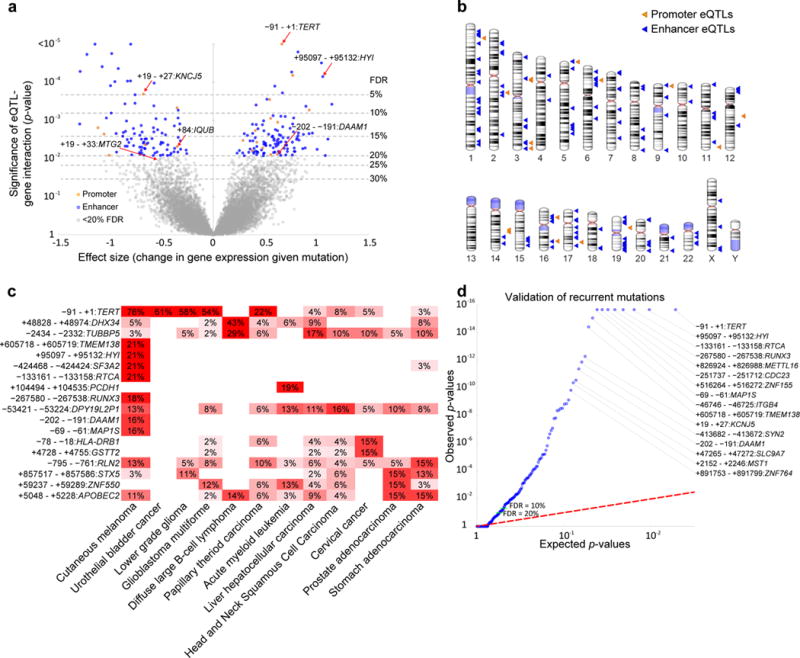
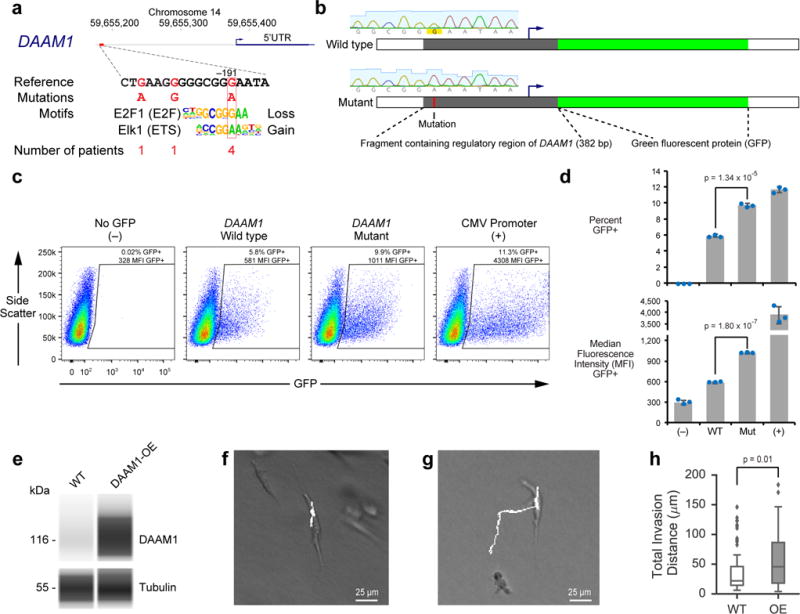
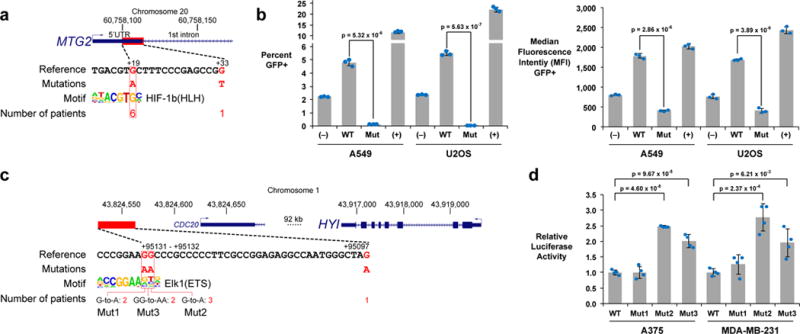
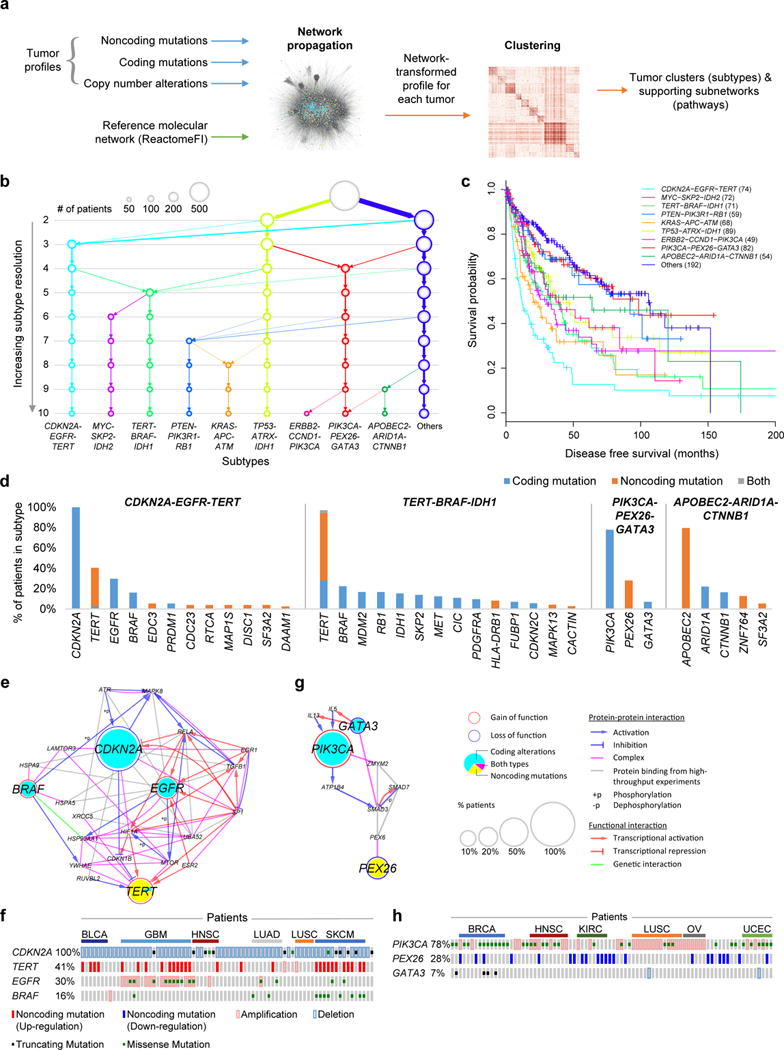
Although cancer genomes are replete with noncoding mutations, the effects of these mutations remain poorly characterized. Here we perform an integrative analysis of 930 tumor whole genomes and matched transcriptomes, identifying a network of 193 noncoding loci in which mutations disrupt target gene expression. These 'somatic eQTLs' (expression quantitative trait loci) are frequently mutated in specific cancer tissues, and the majority can be validated in an independent cohort of 3,382 tumors. Among these, we find that the effects of noncoding mutations on DAAM1, MTG2 and HYI transcription are recapitulated in multiple cancer cell lines and that increasing DAAM1 expression leads to invasive cell migration. Collectively, the noncoding loci converge on a set of core pathways, permitting a classification of tumors into pathway-based subtypes. The somatic eQTL network is disrupted in 88% of tumors, suggesting widespread impact of noncoding mutations in cancer.


Conflict of interest statement

COMPETING FINANCIAL INTERESTS

Trey Ideker is co-founder of Data4Cure, Inc. and has an equity interest. Trey Ideker has an equity interest in Ideaya BioSciences, Inc. The terms of this arrangement have been reviewed and approved by the University of California, San Diego, in accordance with its conflict of interest policies. No potential conflicts of interest were disclosed by the other authors.

Figures

Figure 1
Figure 1. Mutation calling and somatic eQTL analysis
(a) Types of data and numbers of tumors used in this study. (b) Number of mutations called per tumor. Boxplots show the distribution of this number within tumors of each tissue type (center line, median; upper and lower hinges, first and third quartiles; whiskers, highest and lowest values within 1.5 times the interquartile range outside hinges; dots, outliers beyond 1.5 times interquartile range). The number of tumors of each type (sample size) is shown on the right panel. (c) Clustering of somatic noncoding mutations resulting in identification of recurrently mutated loci. (d) Workflow of somatic eQTL analysis.
Figure 2
Figure 2. Effect size and recurrence of somatic eQTLs
(a) Volcano plot of associations between somatic eQTLs and the expression levels changes of their target genes, evaluated by significance (y-axis, F-test p-value, n = 783 tumors) versus effect size (x-axis). One unit on the x-axis represents one standard deviation of change in gene expression. FDR is calculated using the Storey approach. Selected somatic eQTLS are labeled by coordinates in base pairs relative to the TSS of the target gene. (b) Ideogram of the 193 significant somaitc eQTLs at FDR < 20%. (c) Heatmap showing the percentage of patients in various cancer tissues with alterations in each somatic eQTL. Somatic eQTLs and cancer tissues with ≥ 15% mutation rates are shown. (d) Validation of somatic eQTL recurrence in a pan-cancer cohort from ICGC. The quantile–quantile plot shows the observed empirical p-values of mutation recurrence (n = 3,382 tumors) compared to the random expectation for the 193 somatic eQTLs. FDR is calculated using the Benjamini-Hochberg approach.
Figure 3
Figure 3. Functional validation of the mutated DAAM1 regulatory element
(a) A somatic eQTL in the DAAM1 promoter region is associated with increased mRNA expression levels. (b) Schematic of wild type and mutant GFP reporter constructs along with the Sanger sequencing traces confirming the sequence of the key nucleotide. (c) Flow cytometry analysis of A375 human melanoma cells 48 hours after transient transfection. The polygon delineated by black lines shows the gated region used to define GFP+ cells. (d) Bar graphs (average ± standard deviation across 3 cell culture replicates; p-values from two-tailed t-tests) showing the percentage of GFP+ cells and the median fluorescence intensity of the GFP+ cells. Individual data points are in Supplementary Table 5. (e) Protein electropherogram analysis of wild type and DAAM1 overexpressing MDA-MB-231 cells using the antibodies against DAAM1 and tubulin. The complete electropherogram is in Supplementary Fig. 6e. The image is representative of two independent cell culture experiments. (f, g) Sample trajectories of (f) wild type and (g) DAAM1-overexpressing cells embedded in 2.5 mg/mL 3D collagen hydrogels. (h) Total invasion distance travelled by individual cells (p-value from two-tailed Mann–Whitney U test; 95% confidence intervals of mean are (32.3 μm, 48.2 μm) and (47.6 μm, 67.0 μm) for wild type and DAAM1-overexpressing cells, respectively). Imaging and quantitation was performed on 74 and 83 cells in the wild type and DAAM1-overexpression groups, respectively. Box-plot elements are defined as Fig. 1b.
Figure 4
Figure 4. Additional case studies
(a) The somatic eQTL associated with downregulation of MTG2 is located in its 5′ UTR and frequently alters a potential HIF-1b binding motif. (b) Flow cytometry analysis of A549 lung epithelial carcinoma cells and U2OS bone osteosarcoma cells 48 hours after transient transfection with MTG2 GFP reporter constructs. Bar graphs (mean ± standard deviation across three cell culture replicates; p-values from two-tailed t-tests) showing the percentage of GFP+ cells and the median fluorescence intensity of GFP+ events. (c) The somatic eQTL associated with upregulation of HYI is located 95 kb downstream of the TSS and frequently alters a potential Ets family binding motif. (d) Luciferase assay results (mean ± standard deviation across four cell culture replicates; p-values from two-tailed t-tests) for the HYI somatic eQTLs 48 hours after transient transfection in A375 melanoma cells and MDA-MB-231 breast cancer cells. Individual data points are available in Supplementary Tables 5 and 6.
Figure 5
Figure 5. Identification of molecular networks and associated tumor subtypes incorporating noncoding mutations
(a) Workflow of Network-Based Stratification. (b) Resulting hierarchy of subtypes, at increasing resolution from 2-10 subtypes. (c) Disease-free survival probabilities (y-axis) are plotted against time after diagnosis in months (x-axis) for each of the identified cancer subtypes (colors). Patients with censored survival data are indicated by a “+” at the censoring time (last follow-up). (d) Signature genes are shown for each subtype with a large proportion of patients with noncoding mutations (x-axis), ordered by the percent of patients with alterations (y-axis). (e, g) Pathways characterizing (e) CDKN2A-EGFR-TERT or (g) PIK3CA-PEX26-GATA3 subtypes, defined as subnetwork regions extracted from ReactomeFI by Network-Based Stratification. (f, h) Mutation matrix of the (f) CDKN2A-EGFR-TERT or (h) PIK3CA-PEX26-GATA3 pathway subtypes showing individual tumors (columns, ordered by cancer tissues) with indicated types of mutations on signature genes for that subtype (rows).

References

    1. Cancer Genome Atlas Research Network et al. The Cancer Genome Atlas Pan-Cancer analysis project. Nat Genet. 2013;45:1113–1120. - PMC - PubMed
    1. International Cancer Genome Consortium et al. International network of cancer genome projects. Nature. 2010;464:993–998. - PMC - PubMed
    1. Hofree M, et al. Challenges in identifying cancer genes by analysis of exome sequencing data. Nat Commun. 2016;7:12096. - PMC - PubMed
    1. Iorio F, et al. A Landscape of Pharmacogenomic Interactions in Cancer. Cell. 2016;166:740–754. - PMC - PubMed
    1. Khurana E, et al. Role of non-coding sequence variants in cancer. Nat Rev Genet. 2016;17:93–108. - PubMed

Methods-only References

    1. Quinlan AR, Hall IM. BEDTools: a flexible suite of utilities for comparing genomic features. Bioinformatics. 2010;26:841–842. - PMC - PubMed
    1. Li B, Dewey CN. RSEM: accurate transcript quantification from RNA-Seq data with or without a reference genome. BMC Bioinformatics. 2011;12:323. - PMC - PubMed
    1. Stegle O, Parts L, Durbin R, Winn J. A Bayesian framework to account for complex non-genetic factors in gene expression levels greatly increases power in eQTL studies. PLoS Comput Biol. 2010;6:e1000770. - PMC - PubMed
    1. Stegle O, Parts L, Piipari M, Winn J, Durbin R. Using probabilistic estimation of expression residuals (PEER) to obtain increased power and interpretability of gene expression analyses. Nat Protoc. 2012;7:500–507. - PMC - PubMed
    1. Storey JD, Tibshirani R. Statistical significance for genomewide studies. Proc Natl Acad Sci U S A. 2003;100:9440–9445. - PMC - PubMed

Publication types

MeSH terms