. 2018 May;14(5):507-515.
doi: 10.1038/s41589-018-0031-6. Epub 2018 Apr 2.

FINO2 initiates ferroptosis through GPX4 inactivation and iron oxidation

Affiliations

FINO2 initiates ferroptosis through GPX4 inactivation and iron oxidation

Michael M Gaschler et al. Nat Chem Biol. 2018 May.

Abstract

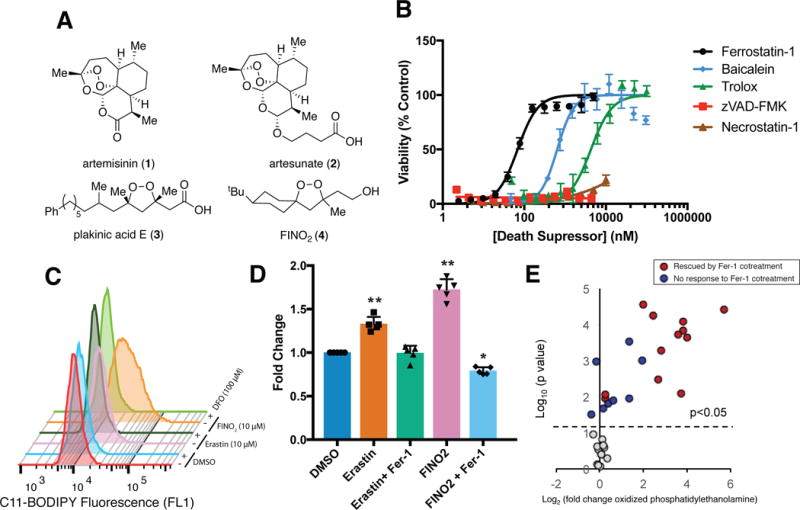
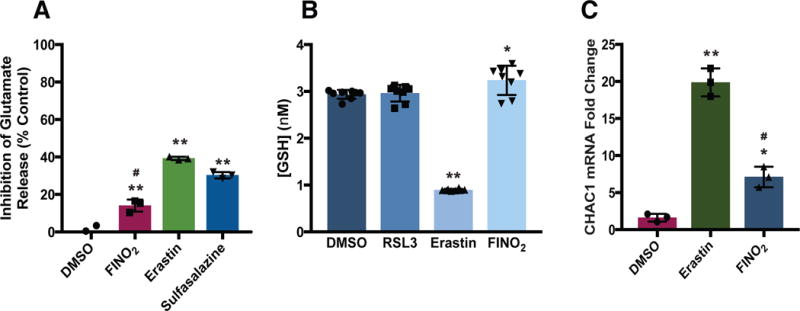
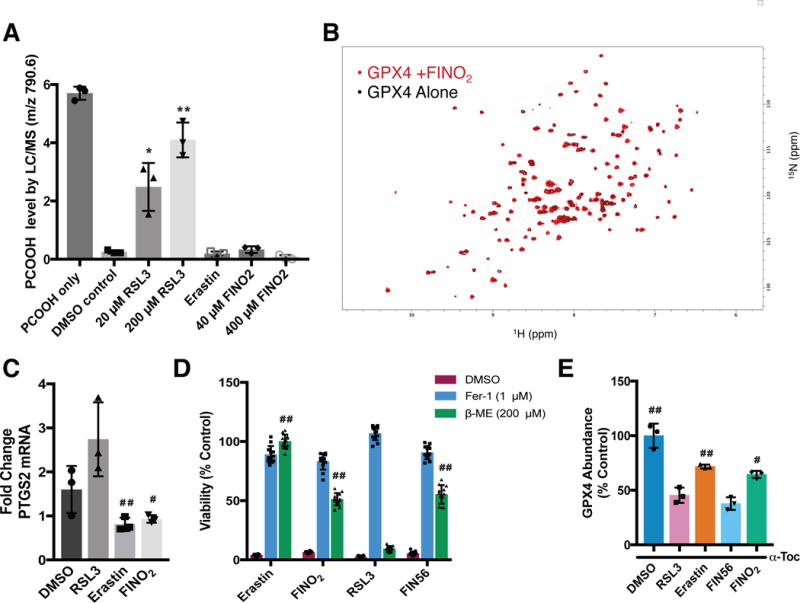
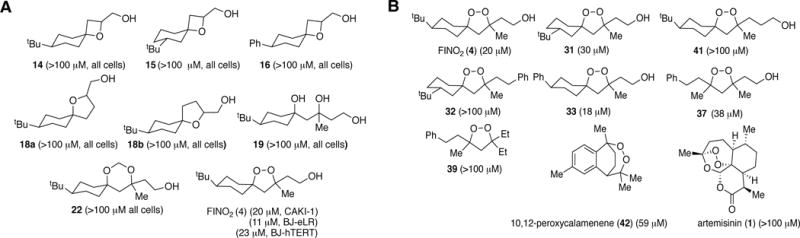
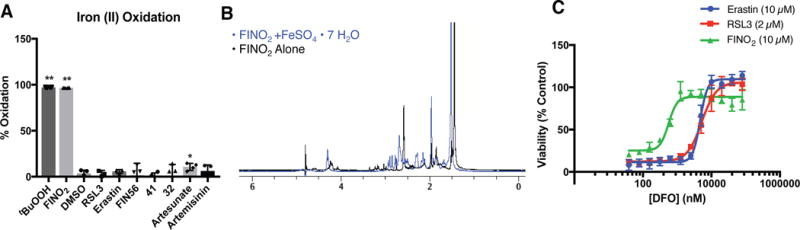
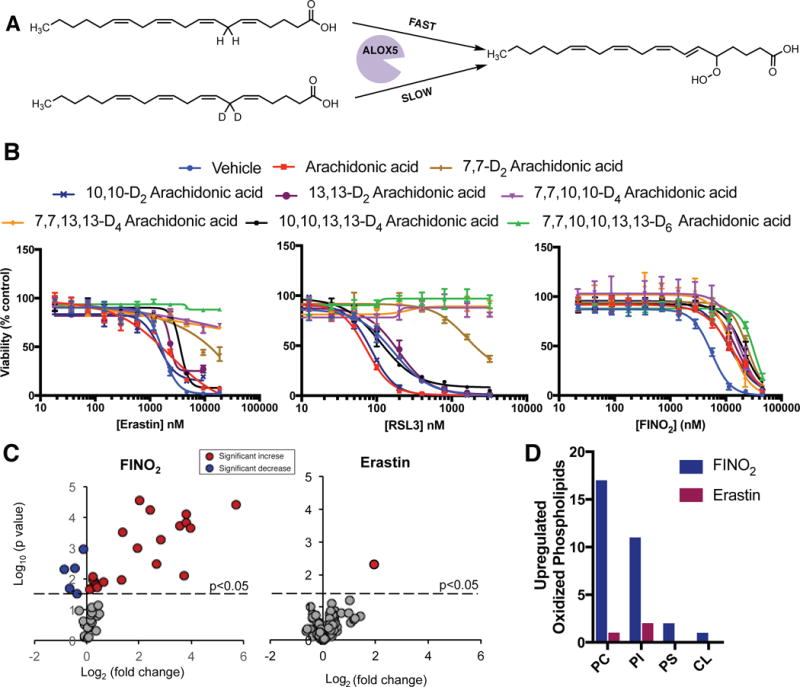
Ferroptosis is a non-apoptotic form of regulated cell death caused by the failure of the glutathione-dependent lipid-peroxide-scavenging network. FINO2 is an endoperoxide-containing 1,2-dioxolane that can initiate ferroptosis selectively in engineered cancer cells. We investigated the mechanism and structural features necessary for ferroptosis initiation by FINO2. We found that FINO2 requires both an endoperoxide moiety and a nearby hydroxyl head group to initiate ferroptosis. In contrast to previously described ferroptosis inducers, FINO2 does not inhibit system xc- or directly target the reducing enzyme GPX4, as do erastin and RSL3, respectively, nor does it deplete GPX4 protein, as does FIN56. Instead, FINO2 both indirectly inhibits GPX4 enzymatic function and directly oxidizes iron, ultimately causing widespread lipid peroxidation. These findings suggest that endoperoxides such as FINO2 can initiate a multipronged mechanism of ferroptosis.


Conflict of interest statement

Conflict of Interest

M.S. Shchepinov declares a competing financial interest as the Chief Scientific Officer of Retrotrope, Inc., all other authors declare no competing financial interests.

Figures

Figure 1
Figure 1. FINO2 induces ferroptotic cell death
(A) Organic peroxides and FINO2 (B) The dose-dependent effect of cell death-suppressing compounds on ferroptosis triggered by FINO2 (10 μM) in HT-1080 cells. Viability measured 24 h after compound treatment. Experiments were performed with triplicate cell cultures. Data are plotted as the mean ± s.d., n=3. (C) Ability of iron chelator deferoxamine (DFO) to prevent ferroptosis-dependent C11-BODIPY oxidation when incubated together for 6 h. Three independent experiments were performed with similar results. (D) Ability of ferrostatin-1 (Fer-1) (2 μM) to prevent accumulation of thiobarbituric acid reactive substances (TBARS) when co-treated with erastin (5 μM) or FINO2 (10 μM) for 6 h. Data are plotted as the mean ± s.d., n=5. P values were determined using one-way ANOVA; *P=0.003, **P < 0.001 versus DMSO control. (E) Changes in oxidized phosphatidylethanolamine abundance as detected by LC-MS after treatment with FINO2 (10 μM) for 6 h. Individual lipid species are plotted based on their Log2 fold change in abundance (horizontal axis) and the statistical significance of the change (Log10 P-value) on the vertical axis. P values were determined using two-sided t test. Lipid species with significant change upon FINO2 treatment were plotted above the dot line (p<0.05). Experiments were performed in triplicate with biologically independent samples.
Figure 2
Figure 2. FINO2 does not alter glutathione homeostasis
(A) Effect of FINO2 (10 μM) and system xc inhibitors erastin (10 μM) and sulfasalazine (1 mM) on glutamate release after 1 h incubation. Data are plotted as the mean ± s.d., n=3 biologically independent samples. **P and #P < 0.001 versus DMSO control and Erastin, respectively. (B) Intracellular GSH levels in HT-1080 cells treated with ferroptosis inducers RSL3 (0.5 μM) for 90 m or erastin (5 μM), and FINO2 (10 μM) for 6 h, data are plotted as the mean ± s.d., n=8 biologically independent samples. *P=0.016, **P<0.001 versus DMSO control. (C) CHAC1 mRNA levels following erastin (10 μM) or FINO2 (10 μM) treatment for 6 h. Data are plotted as the mean ± s.d., n=3 biologically independent samples. *P=0.007, **P<0.001 versus DMSO control; #P < 0.001 versus erastin. All P values were determined using one-way ANOVA.
Figure 3
Figure 3. FINO2 indirectly inhibits GPX4 activity
(A) Effect of ferroptosis inducers on GPX4 activity within the GPX4-containing cell lysates. Cell lysates were treated with PCOOH and GSH and the abundance of PCOOH was measured by LC-MS. Data are plotted as the mean ± s.d., n=3 biologically independent samples. *P=0.009, **P < 0.001 versus DMSO control (B) HSQC spectrum of GPX4 protein (black; 50 μM) overlaid with the spectrum of GPX4 incubated with FINO2 for 6 h (red; 50 μM and 500 μM, respectively) (C) PTGS2 mRNA levels following treatment with RSL3 (0.5 μM), erastin (10 μM), and FINO2 (10μM) for 6 h. Data are plotted as the mean ± s.d., n=3 biologically independent samples. #P=0.021, ##P=0.017 versus RSL3. (D) Ability of β-mercaptoethanol to prevent ferroptosis initiated by different ferroptosis inducers. Viability measured 24 h after co-treatment. Data are plotted as the mean ± s.d., n=12 biologically independent samples. ##P < 0.001 versus RSL3. (E) GPX4 protein abundance in HT-1080 cells co-treated with RLS3 (1 μM), erastin (10 μM), FIN56 (5 μM), or FINO2 (10 μM) and 100 μM α-tocopherol for 10 h, data are plotted as the mean ± s.d., n=3 biologically independent samples. #P=0.002, ##P<0.001 versus FIN56. Representative blot image is shown in Supplementary Figure 7. All P values were determined using unpaired two-tailed Student’s t-test.
Figure 4
Figure 4. Potency of non-peroxide analogs (A) and peroxide analogs (B) of FINO2
BJ-eLR, BJ-hTERT, or CAKI-1 cells were treated with either vehicle (DMSO), FINO2, or a FINO2 analogue at 5, 10, 25, 50, or 100 μM concentrations for 48 h. Cell viability was then measured and normalized to the DMSO vehicle to extract EC50 values. EC50 values are shown in parentheses. Compounds 15, 31, 32 and 37 were tested as a mixture of diastereomers
Figure 5
Figure 5. FINO2 directly oxidizes ferrous ion
(A) Oxidation of ferrous iron (500 μM) in the presence of different oxidizing agents (500 μM). Data are plotted as the mean ± s.d., n=4 biologically independent samples. P values were determined using unpaired two-tailed Student’s t-test. *P = 0.035, **P<0.001 versus DMSO control. (B) 1H-NMR showing degradation of FINO2 following incubation with FeSO4•7H2O in CD3CN/D2O (1:1) for 12 h. (C) Ability of iron chelator deferoxamine (DFO) to inhibit ferroptosis initiated by different ferroptosis inducers. Experiments were performed in triplicate with three biologically independent samples. Data are plotted as the mean ± s.d..
Figure 6
Figure 6. Ferroptosis initiated by FINO2 oxidizes a large subset of the lipidome independent of lipoxygenase activity
(A) Schematic of lipoxygenase inhibition by deuterated arachidonic acid. (B) Effect of deuterated arachidonic acid incubation (80 μM for 24 h) on HT-1080 sensitivity to ferroptosis inducers. Experiments were performed in triplicate with biologically independent samples. Data are plotted as the mean ± s.d.. (C) Volcano plots showing the change in abundance of oxidized phosphatidylethanolamine species in HT-1080 cells following incubation with FINO2 (10 μM) or erastin (5 μM) for 6 h. Red circles indicate significant increase in abundance, blue circles indicate a significant depletion following treatment. Experiments were performed in triplicate with biologically independent samples. P values were determined using two-sided t test. Lipid species with significant change upon FINO2 treatment were plotted above the dot line (p<0.05). (D) Number of oxidized phosphatidylcholine (PC), phosphatidylinositol (PI), phosphatidylserine (PS), and cardiolipin (CL) species upregulated in HT-1080 cells following treatment with FINO2 (10 μM) or erastin (5 μM) for 6 h.

References

    1. Elmore S. Apoptosis: a review of programmed cell death. Toxicol Pathol. 2007;35:495–516. - PMC - PubMed
    1. Lockshin RA, Zakeri Z. Programmed cell death and apoptosis: origins of the theory. Nat Rev Mol Cell Biol. 2001;2:545–550. - PubMed
    1. Dixon SJ, et al. Ferroptosis: an iron-dependent form of nonapoptotic cell death. Cell. 2012;149:1060–1072. - PMC - PubMed
    1. Yang WS, et al. Regulation of ferroptotic cancer cell death by GPX4. Cell. 2014;156:317–331. - PMC - PubMed
    1. Cao JY, Dixon SJ. Mechanisms of ferroptosis. Cell Mol Life Sci. 2016;73:2195–2209. - PMC - PubMed

Methods-only References

    1. Folch J, Lees M, Sloane Stanley GH. A simple method for the isolation and purification of total lipides from animal tissues. J Biol Chem. 1957;226:497–509. - PubMed
    1. Boettcher C, Pries C, Vangent CM. A rapid and sensitive sub-micro phosphorus determination. Anal Chim Acta. 1961;24:203–204.
    1. Tyurina YY, et al. A mitochondrial pathway for biosynthesis of lipid mediators. Nat Chem. 2014;6:542–552. - PMC - PubMed
    1. Shimada K, Hayano M, Pagano N, Stockwell BR. Cell-line selectivity improves the predictive power of pharmacogenomic analyses and helps identify NADPH as biomarker for ferroptosis sensitivity. Cell Chem Biol. 2016;23:225–235. - PMC - PubMed

Publication types

MeSH terms