. 2018 Apr 3;9(1):1300.
doi: 10.1038/s41467-018-03570-9.

A lever-like transduction pathway for long-distance chemical- and mechano-gating of the mechanosensitive Piezo1 channel

Affiliations

A lever-like transduction pathway for long-distance chemical- and mechano-gating of the mechanosensitive Piezo1 channel

Yanfeng Wang et al. Nat Commun. .

Abstract

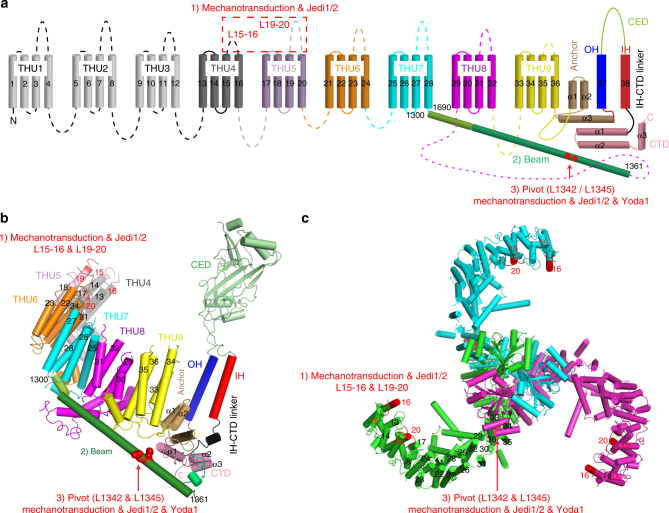
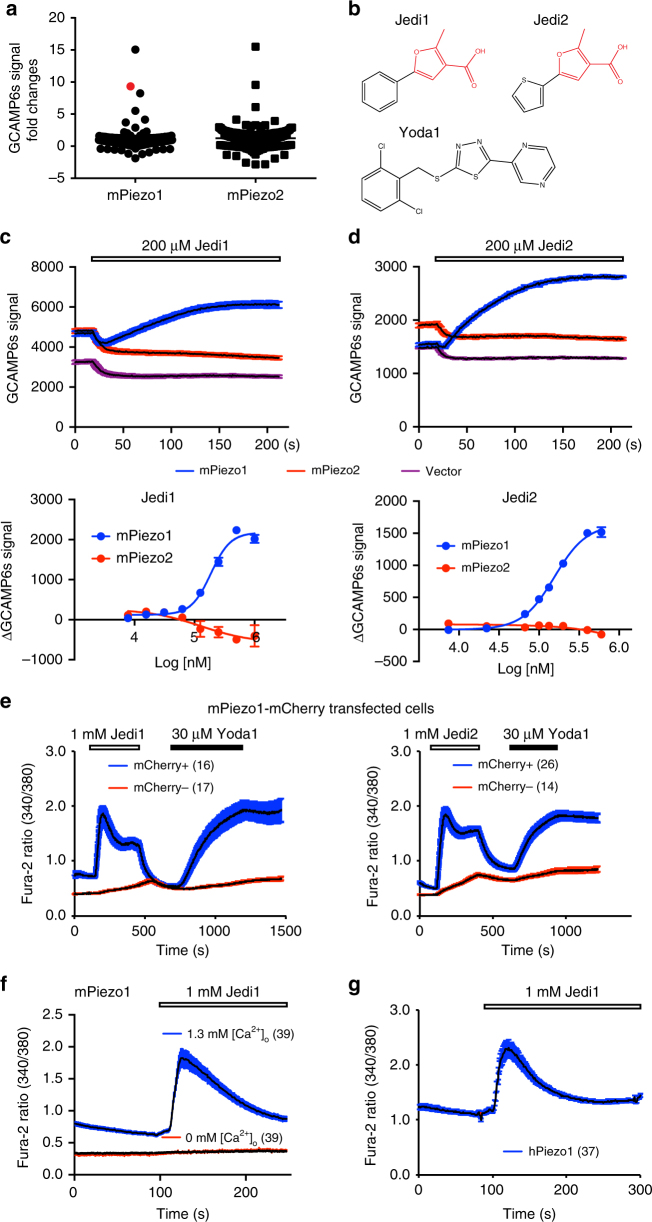
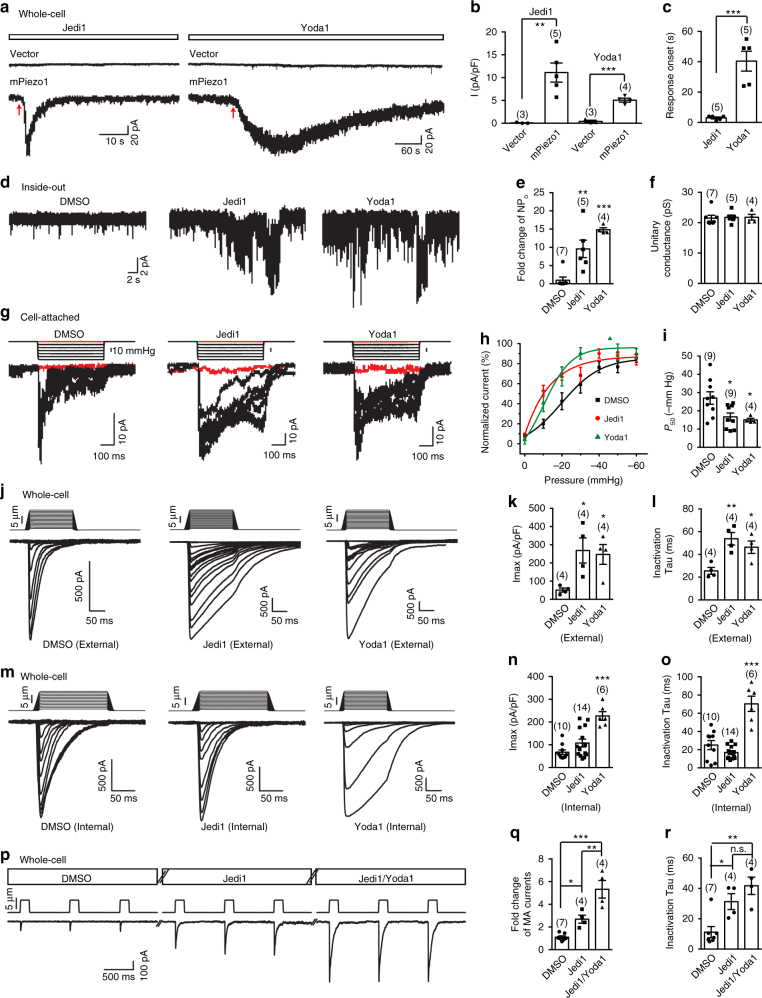
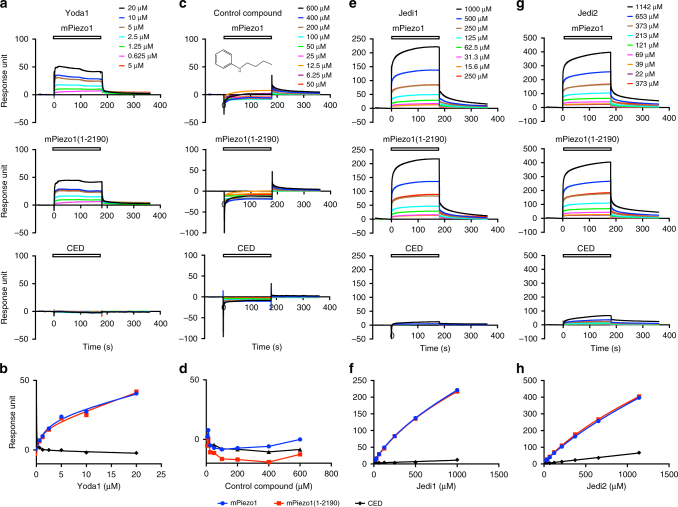
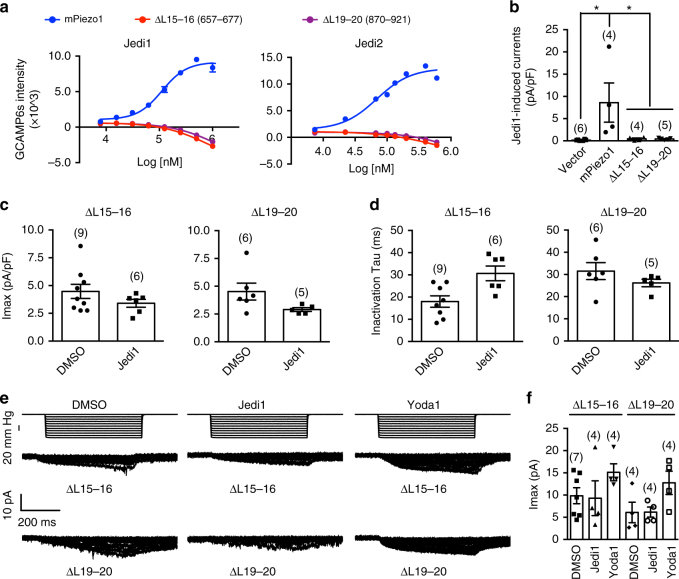
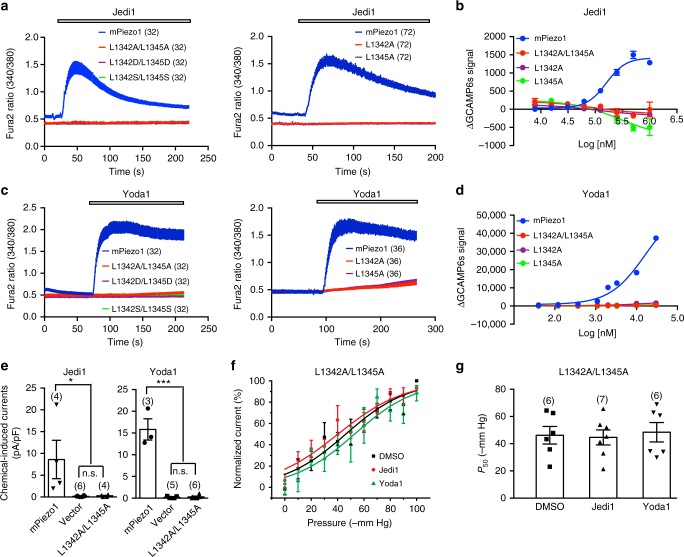
Piezo1 represents a prototype of eukaryotic mechanotransduction channels. The full-length 2547-residue mouse Piezo1 possesses a unique 38-transmembrane-helix (TM) topology and is organized into a three-bladed, propeller-shaped architecture, comprising a central ion-conducting pore, three peripheral blade-like structures, and three 90-Å-long intracellular beam-resembling structures that bridge the blades to the pore. However, how mechanical force and chemicals activate the gigantic Piezo1 machinery remains elusive. Here we identify a novel set of Piezo1 chemical activators, termed Jedi, which activates Piezo1 through the extracellular side of the blade instead of the C-terminal extracellular domain of the pore, indicating long-range allosteric gating. Remarkably, Jedi-induced activation of Piezo1 requires the key mechanotransduction components, including the two extracellular loops in the distal blade and the two leucine residues in the proximal end of the beam. Thus, Piezo1 employs the peripheral blade-beam-constituted lever-like apparatus as a designated transduction pathway for long-distance mechano- and chemical-gating of the pore.


Conflict of interest statement

The authors declare no competing interests.

Figures

Fig. 1
Fig. 1
Topological and structural illustration of the designated mechanical and chemical activation of Piezo1. a, b A topological model (a) and structural model (based on the PDB 5Z10) (b) of Piezo1 showing the featured domains revealed from the reported cryo-EM structure of Piezo1, including the nine repetitive THUs, beam, anchor, and the C-terminal pore module comprising the OH, CED, IH, and CTD. The N-terminal THU1-THU3 were not structurally resolved. c Top view of the trimeric Piezo1 channel showing the three-bladed, propeller-like architecture and location of the L15-16 and L19-20 at the distal end of the blade. Key structural components involved in mechanical and chemical activation of Piezo1, including the extracellular loops of L15-16 and L19-20, beam, and L1342/L1345 (proposed to form the pivot of the beam), are labeled in ac. As illustrated in steps (1)–(3), the blade-beam might form a designated transduction pathway for propagating action from the extracellular side of the distal blade to the central pore via utilizing the intracellular beam as a lever-like apparatus
Fig. 2
Fig. 2
Identification of Jedi1 and Jedi2 that evoke Piezo1-mediated Ca2+ influx. a A summary view of fold changes of the GCAMP6s fluorescent signal of HEK293T cells co-transfected with either mPiezo1 or mPiezo2 and GCAMP6s in response to 96 compounds assayed by FLIPR in a 96-well format. The red dot represents a compound that evoked specific response in mPiezo1- but not in mPiezo2-transfected cells. b The chemical structures of Jedi1, Jedi2, and Yoda1. c, d Top panels: representative FLIPR traces showing the GCAMP6s fluorescent signal changes of HEK293T cells transfected with the indicated constructs in response to either 200 μM Jedi1 (left panel) or Jedi2 (right panel). The black trace represents the average response of 4-well repeats. Error bars are shown in colors. The addition of compound solution into the well caused an artifact drop of the fluorescent signal. The slow activation kinetics might be due to the slow Ca2+-binding kinetics of GCAMP6s. Lower panels: Jedi1 and Jedi2 dose response curves of mPiezo1- or mPiezo2-transfected cells (with GCAMP6s) as assayed by FLIPR. The compound-induced GCAMP6s signal change at each dose point from vector-transfected cells was correspondingly subtracted. The curve was fitted with a Boltzmann equation. Each data point represents mean ± s.e.m., n = 4 wells. e Representative Fura-2 ratio (340/380) traces obtained from single-cell Ca2+ imaging of mPiezo1-mCherry-transfected HEK293T cells in response to the indicated conditions. The black traces show the average responses of the mCherry-positive or -negative cells imaged from the same coverslip. The number of cells used for averaging is indicated. Error bars are shown in colors. f, g Single-cell Fura-2 Ca2+ imaging experiments showing the average response of mPiezo1 (f)- or human Piezo1 (hPiezo1) (g)-expressing cells in response to the indicated conditions. The number of cells used for averaging is indicated. Similar results were obtained from at least three experiments for data eg
Fig. 3
Fig. 3
Electrophysiological effects of Jedi1 and Yoda1 on Piezo1. a Representative whole-cell current traces in response to either 1 mM Jedi1 or 30 μM Yoda1, which was puffed onto the recorded cells. The red arrows indicate the onset of the current. b, c Scatter plot of the current amplitudes (b) or onset (c) induced by the compound. Statistical significance was assessed using the unpaired Student’s t-test. d Representative channel activities of mPiezo1-expressing cells in the inside-out patch configuration at −80 mV. The compounds were in the pipette solution. e, f Scatter plot of the NPo (e) or unitary conductance (f). Statistical significance was assessed using one-way ANOVA with Dunn’s comparison to DMSO. g Representative stretch-activated currents at −80 mV from mPiezo1-expressing cells. The red traces show the single-channel activities in the absence of externally applied force (Supplementary Fig. 1d). h Pressure-current relationships fitted with a Boltzmann equation. i Scatter plot of the P50 calculated from fit of the pressure-current relationship of individual recordings with a Boltzmann equation. Statistical significance was assessed using one-way ANOVA with Dunn’s comparison to DMSO. j, m Representative traces of poking-induced inward currents at −60 mV with the indicated compound present either in the extracellular (j) or internal (m) recording buffer. k, n Scatter plot of the maximal poking-induced currents. Statistical significance was assessed using one-way ANOVA with Dunn’s comparison to DMSO. l, o Scatter plot of the inactivation Tau of the poking-induced currents. Statistical significance was assessed using one-way ANOVA with Dunn’s comparison to DMSO. p Three consecutive poking-induced current traces that reached the steady state under DMSO, 200 μM Jedi1, and 200 μM Jedi1/30 μM Yoda1, respectively, are shown. q, r Scatter plot of the fold change (q) or inactivation tau (r) of the poking-induced currents. Statistical significance was assessed using one-way ANOVA with Tukey’s multiple comparisons test. Each bar represents mean ± s.e.m., and the recorded cell number is labeled above the bar. ***P < 0.001, **P < 0.01, *P < 0.05
Fig. 4
Fig. 4
Jedi1/2 and Yoda1 bind to the fragment of residues 1–2190. a, c, e, g Representative SPR traces of the immobilized purified mPiezo1 (top panel), mPiezo1(1–2190) (middle panel), and CED (lower panel) in response to the series of concentrations of the indicated compounds measured with the affinity mode. To validate the reproducibility of the immobilized proteins regenerated after each dose point, a same dose (5, 50, 250, and 373 μM for Yoda1, control compound, Jedi1, and Jedi2, respectively) was re-tested. As exemplified in e, the red line overlaps with the brown line, indicating the reproducibility of the immobilized proteins for the assay. b, d, f, h The resulting dose-binding curve of the indicated compounds to the indicated proteins. The curves in b, f, and h were fitted with a total-binding equation. Similar results were obtained from two to eight independent experiments
Fig. 5
Fig. 5
L15-16 and L19-20 are essential for Jedi activation of Piezo1. a Dose response curves of HEK293T cells transfected with GCAMP6s and the indicated constructs in response to the specified compounds as assayed by FLIPR. The curves were fitted with a Boltzmann equation. Each data point represents mean ± s.e.m., n = 4 wells. b Scatter plot of the chemical-induced currents from Piezo1-KO-HEK cells transfected with the indicated constructs. Statistical significance was assessed using one-way ANOVA with multiple comparison. c Scatter plot of the poking-induced Imax. Statistical significance was assessed using unpaired, two-tailed Student’s t-test. d Scatter plot of the inactivation tau of the poking-induced currents. Statistical significance was assessed using unpaired, two-tailed Student’s t-test. e Representative stretching-activated currents of cells recorded at −80 mV. f Scatter plot of the maximal stretching-activated currents. Statistical significance was assessed using one-way ANOVA with Dunn’s comparison to the DMSO-treated group. Each bar represents mean ± s.e.m., and the recorded cell number is labeled above the bar. *P < 0.05
Fig. 6
Fig. 6
L1342 and L1345 are essential for Jedi1 and Yoda1 activation of mPiezo1. a, c Representative single-cell Fura-2 Ca2+ imaging traces showing the average responses of cells transfected with the indicated constructs in response to 1 mM Jedi1 (a) or 30 μM Yoda1 (c). b, d Dose response curves of cells transfected with the indicated constructs and GCAMP6s in response to Jedi1 (b) or Yoda1 (d). The curves were fitted with a Boltzmann equation. Each data point represents mean ± s.e.m., n = 4 wells. e Scatter plot of the chemical-induced currents from the Piezo1-KO-HEK cells transfected with the indicated constructs. Statistical significance was assessed using one-way ANOVA with multiple comparison test. f Pressure-current relationships of the stretch-induced currents of the L1342A/L1345A mutant under the indicated compound conditions. The curves were fitted with a Boltzmann equation. g Scatter plot of the P50 calculated from fit of the pressure-current relationship of individual recordings with a Boltzmann equation. Statistical significance was assessed using one-way ANOVA with multiple comparison test. Data shown as mean ± s.e.m., and the recorded cell number is labeled above the bar. *P < 0.05, ***P < 0.001

References

    1. Chalfie M. Neurosensory mechanotransduction. Nat. Rev. Mol. Cell Biol. 2009;10:44–52. doi: 10.1038/nrm2595. - DOI - PubMed
    1. Anishkin A, Loukin SH, Teng J, Kung C. Feeling the hidden mechanical forces in lipid bilayer is an original sense. Proc. Natl Acad. Sci. USA. 2014;111:7898–7905. doi: 10.1073/pnas.1313364111. - DOI - PMC - PubMed
    1. Ranade SS, Syeda R, Patapoutian A. Mechanically activated ion channels. Neuron. 2015;87:1162–1179. doi: 10.1016/j.neuron.2015.08.032. - DOI - PMC - PubMed
    1. Kung C, Martinac B, Sukharev S. Mechanosensitive channels in microbes. Annu. Rev. Microbiol. 2010;64:313–329. doi: 10.1146/annurev.micro.112408.134106. - DOI - PubMed
    1. Coste B, et al. Piezo1 and Piezo2 are essential components of distinct mechanically activated cation channels. Science. 2010;330:55–60. doi: 10.1126/science.1193270. - DOI - PMC - PubMed

Publication types