

Metabolic Profiles in Obese Children and Adolescents with Insulin Resistance
- PMID: 29610610
- PMCID: PMC5874375
- DOI: 10.3889/oamjms.2018.097
Metabolic Profiles in Obese Children and Adolescents with Insulin Resistance
Abstract
Background: In the past several decades, the increasing frequency of overweight and obese children and adolescents in the world has become a public health problem. It has contributed significantly to the already high tide of diabetes, cardiovascular and cerebrovascular diseases.
Aim: To investigate the frequency of insulin resistance and to evaluate the metabolic profile of insulin resistant and non-insulin resistant obese children and adolescents.
Subjects and methods: The study included 96 (45 boys, 51 girls) obese children and adolescents aged 4-17 years old (10.50 ± 2.87 years). Only participants with Body Mass Index ≥ 95 percentile were included. We analysed sera for fasting insulin levels (FI), fasting serum triglycerides (TG), total serum cholesterol (TC), fasting plasma glucose (FPG) and plasma glucose 2 hours after the performance of the oral glucose tolerance test (2-h G). Homeostatic model assessment for insulin resistance (HOMA-IR) index was calculated as fasting insulin concentration (microunits per millilitre) x fasting glucose concentration (millimolar)/22.5. The value of HOMA-IR above 3.16 was used as a cut-off value for both genders.
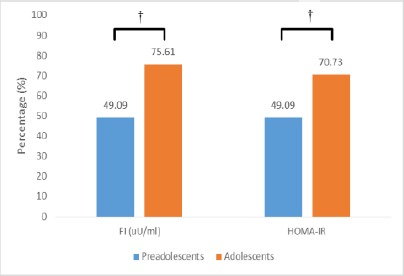
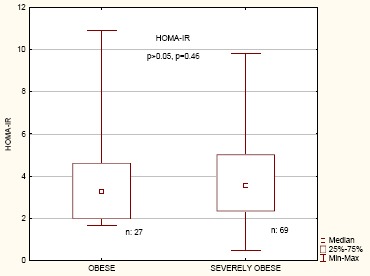
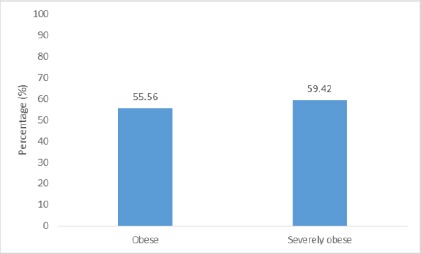
Results: Insulin resistance was determined in 58.33% of study participants. Insulin resistant participants had significantly higher level of 2-h G (p = 0.02), FI level (p = 0.000) as well as TG levels (p = 0.01), compared to non-insulin resistant group. Strikingly, 70.73% of the pubertal adolescents were insulin resistant in comparison to 49.09% of the preadolescents (p = 0.03). Significantly higher percentage of insulin-resistant participants were girls (p = 0.009). Moreover, a higher percentage of the girls (70.59%) than boys (44.44%) had HOMA-IR above 3.16 and had elevated FI levels (70.59% vs 48.89%). The difference in the frequency of insulin resistance among obese versus severely obese children and adolescents was not significant (p = 0.73, p > 0.05). Our study results also showed positive, but weak, correlation of HOMA-IR with age, FPG, TG and BMI of the participants (p < 0.05).
Conclusion: Higher percentage of insulin-resistant participants was of female gender and was adolescents. In general, insulin resistant obese children and adolescents tend to have a worse metabolic profile in comparison to individuals without insulin resistance. It is of note that the highest insulin resistance was also linked with the highest concentrations of triglycerides.
Keywords: Childhood obesity; Homeostatic model assessment of insulin resistance; Insulin resistance; Metabolic parameters; Obesity in adolescents.
Figures
Similar articles
-
Insulin resistance and impaired glucose tolerance in obese children and adolescents referred to a tertiary-care center in Israel.Int J Obes (Lond). 2005 Jun;29(6):571-8. doi: 10.1038/sj.ijo.0802919. Int J Obes (Lond). 2005. PMID: 15889115
-
[Relationship between serum high-sensitivity C-reactive protein and obesity and impaired glycose metabolism in children and adolescents].Zhonghua Er Ke Za Zhi. 2006 Dec;44(12):933-6. Zhonghua Er Ke Za Zhi. 2006. PMID: 17254464 Chinese.
-
Expression of C1q/TNF-related protein-3 (CTRP3) in serum of patients with gestational diabetes mellitus and its relationship with insulin resistance.Eur Rev Med Pharmacol Sci. 2017 Dec;21(24):5702-5710. doi: 10.26355/eurrev_201712_14016. Eur Rev Med Pharmacol Sci. 2017. PMID: 29272006
-
Visfatin in obese children and adolescents and its association with insulin resistance and metabolic syndrome.Scand J Clin Lab Invest. 2015 Apr;75(2):183-8. doi: 10.3109/00365513.2014.1003594. Epub 2015 Feb 27. Scand J Clin Lab Invest. 2015. PMID: 25723377
-
Components of the metabolic syndrome among a sample of overweight and obese Costa Rican schoolchildren.Food Nutr Bull. 2009 Jun;30(2):161-70. doi: 10.1177/156482650903000208. Food Nutr Bull. 2009. PMID: 19689095
Cited by
-
Prevalence of the Effects of Anxiety and Depression on People with Type 2 Diabetes Mellitus: An Analysis of Health Policy Studies in Improving the Quality of Life of Poor Families in the Urban Areas of West Lombok, Indonesia.Curr Diabetes Rev. 2020;16(9):1002-1010. doi: 10.2174/1573399816666200802183738. Curr Diabetes Rev. 2020. PMID: 32744488 Free PMC article.
-
The Impact of Preoperative Fasting Duration on Blood Glucose and Hemodynamics in Children.J Diabetes Res. 2020 Aug 21;2020:6725152. doi: 10.1155/2020/6725152. eCollection 2020. J Diabetes Res. 2020. PMID: 32904566 Free PMC article.
-
Hypertriglyceridemic Waist Phenotype and Its Association with Metabolic Syndrome Components, among Greek Children with Excess Body Weight.Metabolites. 2023 Feb 3;13(2):230. doi: 10.3390/metabo13020230. Metabolites. 2023. PMID: 36837848 Free PMC article.
-
The Effects of COVID-19 Virtual Learning on Body Fat and Insulin Resistance in Adolescents with Overweight or Obesity.Children (Basel). 2023 Aug 16;10(8):1398. doi: 10.3390/children10081398. Children (Basel). 2023. PMID: 37628397 Free PMC article.
-
Τriglycerides-glucose (TyG) index is a sensitive marker of insulin resistance in Greek children and adolescents.Endocrine. 2020 Oct;70(1):58-64. doi: 10.1007/s12020-020-02374-6. Epub 2020 Jun 16. Endocrine. 2020. PMID: 32557329
References
-
- McMorrow AM, Connaughton RM, Lithander FE, et al. Adipose tissue dysregulation and metabolic consequences in childhood and adolescent obesity: potential impact of dietary fat quality. Proc Nutr Soc. 2015;74(1):67–82. https://doi.org/10.1017/S002966511400158X. PMid:25497038. - PubMed
-
- Morandi A, Maffeis C. Predictors of metabolic risk in childhood obesity. Horm Res Paediatr. 2014;82(1):3–11. https://doi.org/10.1159/000362237. PMid:24923289. - PubMed
-
- Lewandowska E, Zieliński A. White adipose tissue dysfunction observed in obesity. Pol Merkur Lekarski. 2016;40(239):333–6. PMid:27234867. - PubMed
-
- Berenson GS. Obesity--a critical issue in preventive cardiology: the Bogalusa Heart Study. Prev Cardiol. 2005;8(4):234–41. quiz 242. https://doi.org/10.1111/j.0197-3118.2005.04485.x. PMid:16230878. - PubMed
-
- Marcovecchio ML, Mohn A, Chiarelli F. Obesity and insulin resistance in children. J Pediatr Gastroenterol Nutr. 2010;51(Suppl 3):S149–50. https://doi.org/10.1097/MPG.0b013e3181f853f9. PMid:21088543. - PubMed
LinkOut - more resources
Full Text Sources
Other Literature Sources
Miscellaneous