Review
. 2017 Nov 10;5(2):1700464.
doi: 10.1002/advs.201700464. eCollection 2018 Feb.

Electrocatalysts for Hydrogen Evolution in Alkaline Electrolytes: Mechanisms, Challenges, and Prospective Solutions

Affiliations
Review

Electrocatalysts for Hydrogen Evolution in Alkaline Electrolytes: Mechanisms, Challenges, and Prospective Solutions

Nasir Mahmood et al. Adv Sci (Weinh). .

Abstract

Hydrogen evolution reaction (HER) in alkaline medium is currently a point of focus for sustainable development of hydrogen as an alternative clean fuel for various energy systems, but suffers from sluggish reaction kinetics due to additional water dissociation step. So, the state-of-the-art catalysts performing well in acidic media lose considerable catalytic performance in alkaline media. This review summarizes the recent developments to overcome the kinetics issues of alkaline HER, synthesis of materials with modified morphologies, and electronic structures to tune the active sites and their applications as efficient catalysts for HER. It first explains the fundamentals and electrochemistry of HER and then outlines the requirements for an efficient and stable catalyst in alkaline medium. The challenges with alkaline HER and limitation with the electrocatalysts along with prospective solutions are then highlighted. It further describes the synthesis methods of advanced nanostructures based on carbon, noble, and inexpensive metals and their heterogeneous structures. These heterogeneous structures provide some ideal systems for analyzing the role of structure and synergy on alkaline HER catalysis. At the end, it provides the concluding remarks and future perspectives that can be helpful for tuning the catalysts active-sites with improved electrochemical efficiencies in future.

Keywords: alkaline electrolytes; electrocatalysts; electrochemical materials; hydrogen evolution reaction.


Figures
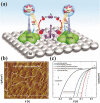
Figure 1
Figure 1
a) Schematic representation of water dissociation, formation of M‐Had intermediates, and subsequent recombination of two Had atoms to form H2 (magenta arrow) as well as OH desorption from the Ni(OH)2 domains (red arrows) followed by adsorption of another water molecule on the same site (blue arrows). Water adsorption requires concerted interaction of O atoms with Ni(OH)2 (broken orange spikes) and H atoms with Pt (broken magenta spikes) at the boundary between Ni(OH)2 and Pt domains. The Ni(OH)2‐induced stabilization of hydrated cations (AC+) (broken dark blue spikes) likely occurs through noncovalent (van der Waals type) interactions. Hydrated AC+ can further interact with water molecules (broken yellow spikes), altering the orientation of water as well as the nature and strength of interaction of the oxide with water. b) STM image (60 nm × 60 nm) and CV trace of the Ni(OH)2/Pt‐islands/Pt(111) surface. Clusters of Ni(OH)2 in the STM image appear ellipsoidal with particle sizes between 4 and 12 nm. c) Comparison of HER activities with Pt(111) as the substrate. Incremental improvements in activities for the HER in 0.1 m KOH from the unmodified Pt(111) surface are shown for the hierarchical materials [ad‐islands, Ni(OH)2, and their combination] as well as the double layer (addition of Li+ cations). The activity for the unmodified Pt(111) surface in 0.1 m HClO4 is also shown for reference (dashed arrow shows the activity trend). Reproduced with permission.13 Copyright 2011, AAAS.
Figure 2
Figure 2
a) Exchange current densities, log(i 0), on monometallic surfaces plotted as a function of the calculated HBE. The i 0s for non‐Pt metals were obtained by extrapolation of the Tafel plots between −1 and −5 mA cmdisk −2 to the reversible potential of the HER and then normalization by the ESAs of these metal surfaces. The dashed lines are guides for the eye. Reproduced with permission.20 Copyright 2013, Royal Society of Chemistry. b) Volcano curve for electrocatalysis of the HER at various metals in terms of dependence of log j o values on metal‐to‐H bond energy. Reproduced with permission.21 Copyright 2000, Elsevier.
Figure 3
Figure 3
a) HER on Pt in a full range of solution pH. Steady state positive‐going sweeps of HER polarization curves of Pt collected in selected H2‐saturated buffered electrolytes. The sweep rate is 10 mV s−1 and the rotating speed is 1600 rpm. The polarization curves have been corrected for solution resistance. b) CVs and HBEs of Pt in a full range of solution pH. Steady state CVs of Pt collected in selected Ar‐saturated electrolytes at a sweep rate of 50 mV s−1. The CV curves have been corrected for solution resistance. Reproduced with permission.58 Copyright 2014, Nature Publishing Group.
Figure 4
Figure 4
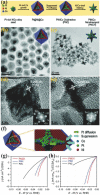
a) Schematic illustration of the formation process of phase segregated Pt–Ni–Co nanostructures. TEM images of b) PNC and c) PNCH with a corresponding inset model. HRTEM with FFT images (insets) of d) PNC and e) PNCH along the 〈110〉 zone axis. The white marks in HRTEM images represent Ni (d111 = 0.205 nm) and Pt (d200 = 0.195 nm), respectively. f) Schematic illustration the structural evolution of PNC. g) HER polarization curves measured in 0.1 m KOH, h) specific current densities normalized by Pt ECSAH. Reproduced with permission.68 Copyright 2016, Royal Society of Chemistry.
Figure 5
Figure 5
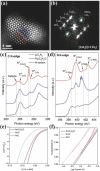
a) HAADF‐STEM images and the b) corresponding FFT patterns of Ru NPs showing mixed fcc/hcp structure. The red and blue dots in panels (a), (c), (e) mark the typical atomic arrangements of fcc and hcp structures along different zone axes. The green circles in panel d inset indicate the shared diffraction plans of the fcc and hcp structures. c) C K‐edge and d) N K‐edge NEXAFS spectra of Ru/C3N4/C electrocatalyst, pure g‐C3N4, and N‐carbon reference samples. In C Kedge, defects at ≈283 eV in all three materials are assigned to low coordinated carbon atoms at the edges of g‐C3N4 and N‐carbon moieties. The resonances of π* at 288.2 eV are assigned to C—N—C species in g‐C3N4, while the resonances of π* at 285.0 eV and π* at 288.7 eV are assigned to C=C and C—N species in N‐carbon. In N Kedge, the resonances of π* at 398.6 and 401.5 eV are assigned to nitrogen species in the form of pyridine (C—N(p)) and graphite (C—N(g)) structures in N‐carbon. The resonances of π* at 399.7 and 402.6 eV are assigned to the aromatic C—N−C coordination of tri‐s‐triazine and the N—3C bridging among three tri‐s‐triazine moieties (C—N(b)) in g‐C3N4. e) HER polarization curves and f) corresponding Tafel plots of the Ru/C3N4/C, conventional Ru/C, and commercial Pt/C electrocatalysts recorded in N2‐purged 0.1 m KOH solutions. The dashed lines in panels are a guide for the eye to calculate j0 by the linear fitting of Tafel plots. In panel (a), the under potential hydrogen adsorption effect in the case of precious metals and the capacitance effect in the case of nanocarbons make that the current start points are not zero. Reproduced with permission.44 Copyright 2016, American Chemical Society.
Figure 6
Figure 6
a,b) SEM images at different magnifications; c) polarization curves, and d) corresponding Tafel plots of Mo2C/NCF in comparison with 20 wt% Pt/C benchmark, Mo‐free NCS, and unpyrolyzed Mo‐PDA in 1M KOH. Reproduced with permission.99 Copyright 2016, American Chemical Society.
Figure 7
Figure 7
a) Polarization curves of P‐W2C@NC after iR correction in 1 m KOH (inset: time dependence of the HER current density of P‐W2C@NC at a static overpotential of 120 mV for 12 h). b) The calculated free‐energy diagram of the HER on various catalysts; the graphene shows a large ΔG(H*) value of 1.832 eV, indicating a negligible adsorption ability of H*. NC shows a positive ΔG(H*) value (1.181 eV), representing a low HER activity. P‐W2C@NC gave a much smaller ΔG(H*) value (−0.112 eV) than its constituents (i.e., W2C, W2C@NC, NC, and C), indicating that P and N dopants in P‐W2C@NC can reduce the value of ΔG(H*) and enhance the initial H* adsorption. Reproduced with permission.117 Copyright 2017, Royal Society of Chemistry.
Figure 8
Figure 8
a) Schematic illustration of water dissociation process in alkaline solutions on NiCo2Px surface. Reproduced with permission.45 b) Schematic illustration of bamboo‐like NiOx@BCNTs. c) Polarization curves for samples calcined at different temperature in 0.1 m KOH solutions. d) TEM image of NiOx@BCNTs treated with acid; e) HRTEM images of NiOx@BCNTs. Inset in part (e) is the fast Fourier transform (FFT) images of Nio. Reproduced with permission.126 Copyright 2016, American Chemical Society.
Figure 9
Figure 9
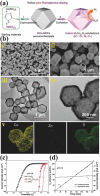
a) Schematic illustration of fabrication of hollow Co‐based bimetallic sulfide. b) SEM (i and ii), TEM (iii and iv) images, and (v) elemental maps of Zn0.30Co2.70S4. c) Polarization data of Zn0.30Co2.70S4, Co3S4 and Pt/C electrodes at pH = 14. d) Electrocatalytic hydrogen production over Zn0.30Co2.70S4 at pH = 14. Reproduced with permission.127 Copyright 2016, American Chemical Society.
Figure 10
Figure 10
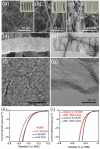
Large‐area SEM images of a) N‐CNT, b) N‐CNT+NGMT, and c) N‐GMT, which are obtained from the same precursor (a 1:40 mixture of glycin and DCDA) at 900, 1,000, and 1100 °C, respectively. Detailed d) SEM, e) TEM, and f–g) HRTEM images of N‐GMT, h) IR‐corrected LSV curves of N‐GMT in basic solution with various KOH concentrations, i) LSV curves of N‐GMT before and after 1000 cycles of cyclic voltammetry in 0.1 and 6 m KOH solution. Scan rate is 10 mV s−1. Reproduced with permission.142 Copyright 2016, Springer.

References

    1. Caban‐Acevedo M., Stone M. L., Schmidt J. R., Thomas J. G., Ding Q., Chang H. C., Tsai M. L., He J. H., Jin S., Nat. Mater. 2015, 14, 1245. - PubMed
    1. Yan Y., Xia B. Y., Zhao B., Wang X., J. Mater. Chem. A 2016, 4, 17587.
    1. Yan Y., Thia L., Xia B. Y., Ge X., Liu Z., Fisher A., Wang X., Adv. Sci. 2015, 2, 1500120. - PMC - PubMed
    1. Rajamathi C. R., Gupta U., Kumar N., Yang H., Sun Y., Suss V., Shekhar C., Schmidt M., Blumtritt H., Werner P., Yan B., Parkin S., Felser C., Rao C. N. R., Adv. Mater. 2017, 29, 1606202. - PubMed
    1. Bates M. K., Jia Q., Ramaswamy N., Allen R. J., Mukerjee S., J. Phys. Chem. C 2015, 119, 5467. - PMC - PubMed