. 2017 Dec 27;5(2):1700531.
doi: 10.1002/advs.201700531. eCollection 2018 Feb.

Guidance and Self-Sorting of Active Swimmers: 3D Periodic Arrays Increase Persistence Length of Human Sperm Selecting for the Fittest

Affiliations

Guidance and Self-Sorting of Active Swimmers: 3D Periodic Arrays Increase Persistence Length of Human Sperm Selecting for the Fittest

Thiruppathiraja Chinnasamy et al. Adv Sci (Weinh). .

Abstract

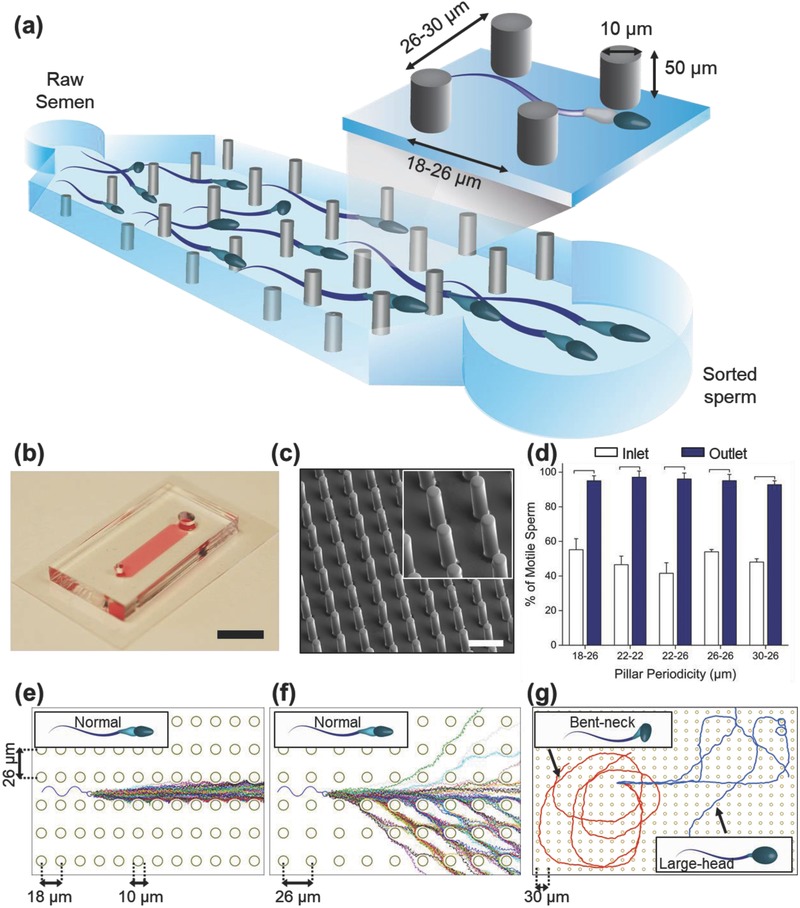
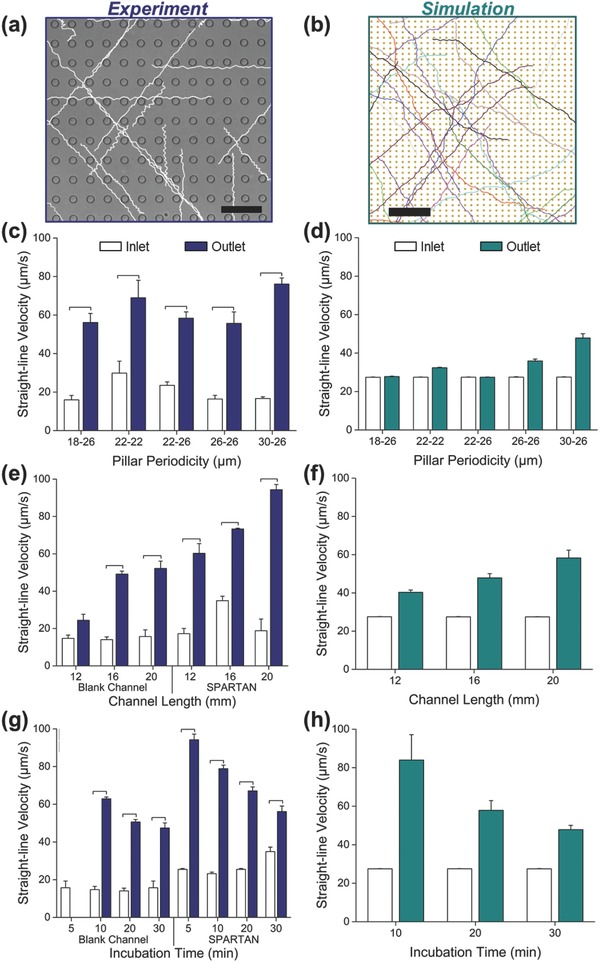
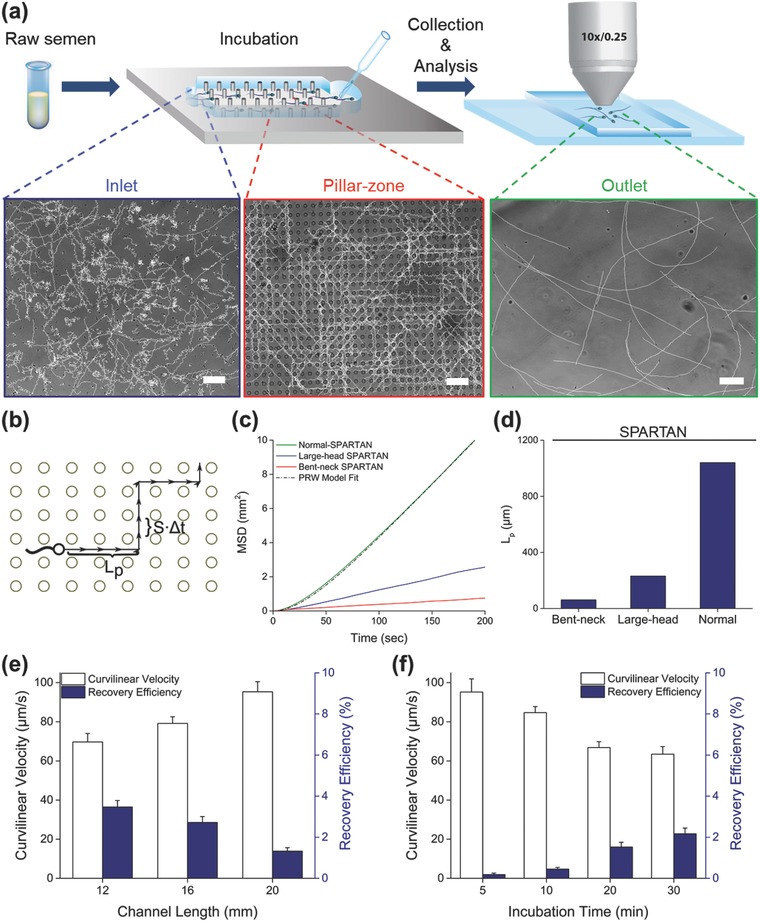
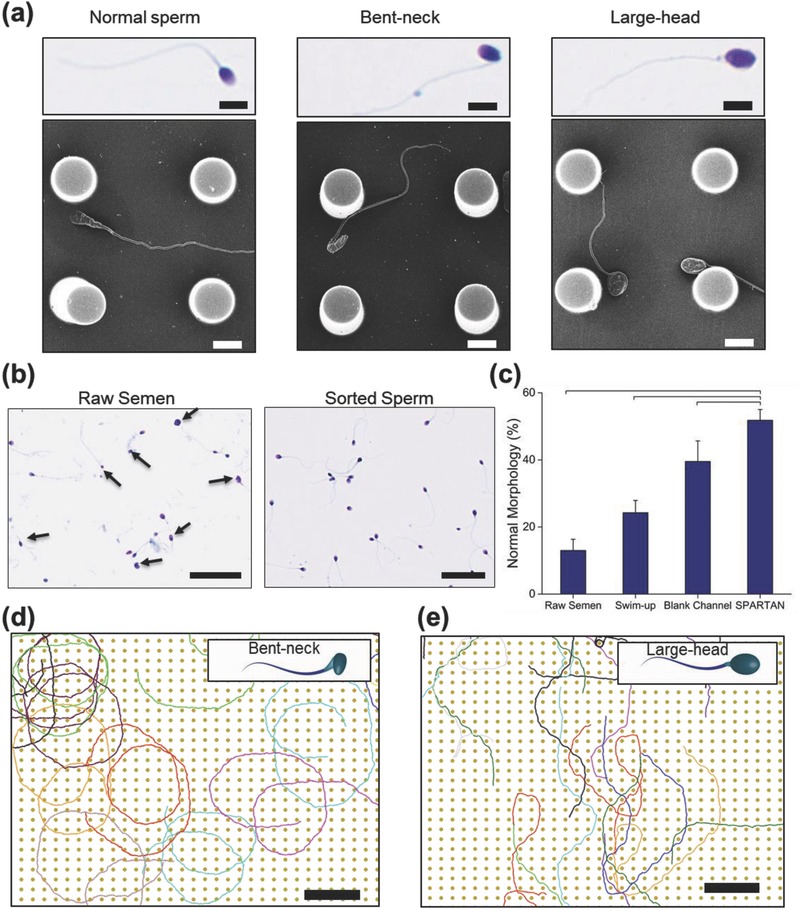
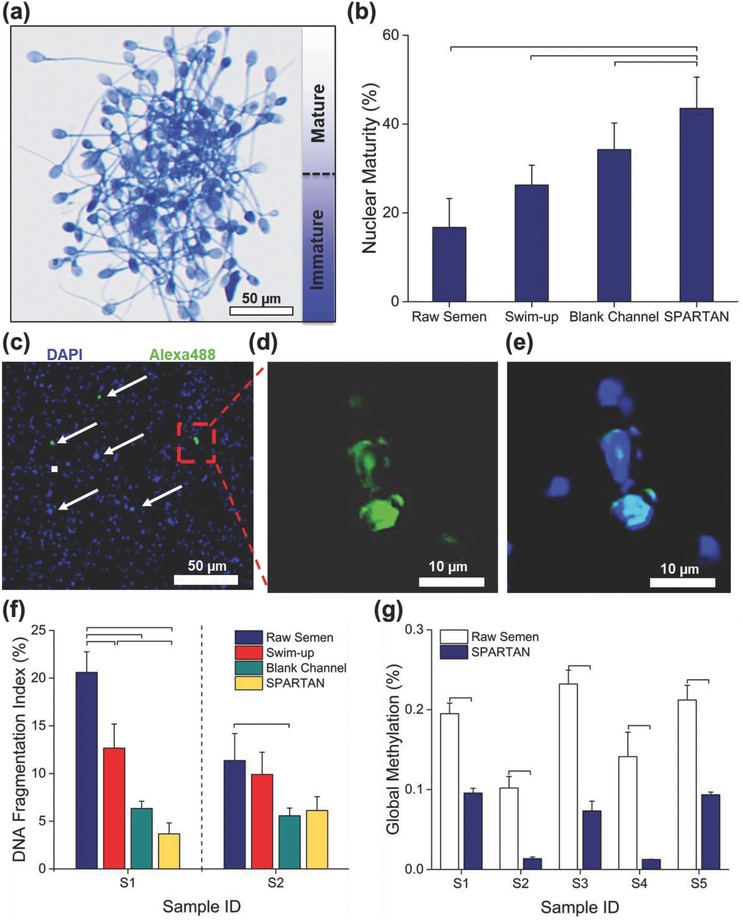
Male infertility is a reproductive disease, and existing clinical solutions for this condition often involve long and cumbersome sperm sorting methods, including preprocessing and centrifugation-based steps. These methods also fall short when sorting for sperm free of reactive oxygen species, DNA damage, and epigenetic aberrations. Although several microfluidic platforms exist, they suffer from structural complexities, i.e., pumps or chemoattractants, setting insurmountable barriers to clinical adoption. Inspired by the natural filter-like capabilities of the female reproductive tract for sperm selection, a model-driven design, featuring pillar arrays that efficiently and noninvasively isolate highly motile and morphologically normal sperm, with lower epigenetic global methylation, from raw semen, is presented. The Simple Periodic ARray for Trapping And isolatioN (SPARTAN) created here modulates the directional persistence of sperm, increasing the spatial separation between progressive and nonprogressive motile sperm populations within an unprecedentedly short 10 min assay time. With over 99% motility of sorted sperm, a 5-fold improvement in morphology, 3-fold increase in nuclear maturity, and 2-4-fold enhancement in DNA integrity, SPARTAN offers to standardize sperm selection while eliminating operator-to-operator variations, centrifugation, and flow. SPARTAN can also be applied in other areas, including conservation ecology, breeding of farm animals, and design of flagellar microrobots for diagnostics.

Keywords: fertility; multiparticle collision dynamics; multiscale simulations; persistence length; sperm sorting.


Figures

Figure 1
Figure 1
SPARTAN (Simple Periodic ARray for Trapping And isolatioN) for selecting motile and morphologically normal sperm. a) Schematic diagram of the microfluidic pillar array and an illustration of pillar dimensions. b) Photograph of the microfluidic device (scale bar: 10 mm). c) FESEM image of the 30 × 26 µm periodic pillar array (scale bar: 50 µm), and a close‐up FESEM image (inset) showing micropillars in detail (scale bar: 20 µm). d) Percentage of motile sperm at different pillar periodicities is plotted. Data are shown as average ± standard deviation. The brackets represent a statistically significant difference compared with the groups using one‐way ANOVA with Tukey's posthoc test for multiple comparisons (N = 3, p < 0.05). e,f) Simulated trajectories of (n = 100) normal morphology sperm in channels with 18 × 26 µm (left) and 26 × 26 µm (right) array periodicities. g) Simulated trajectories for sperm with abnormal morphology in a channel with 30 × 26 µm array periodicity. Trajectories of sperm with a bent neck (0.1π radians) and a larger head (×2 normal) are shown in red and blue, respectively.
Figure 2
Figure 2
Optimization of SPARTAN for efficient sperm sorting. a) In vitro experimental sperm trajectories for the 30 × 26 µm pillar array compared with b) computer‐simulated sperm trajectories (multiscale model). Scale bars are 50 and 200 µm for experiments and simulations, respectively. Straight‐line velocity (VSL) values are compared at the inlet versus outlet after 30 min of incubation from c) experiments and d) simulations, for different pillar array periodicities. e) Experimental measurements of VSL values for channels with 30 × 26 µm array periodicity with varying lengths (30 min of incubation at outlet). f) VSL values obtained from the simulations after 30 min of incubation, for varying channel lengths with 30 × 26 µm array periodicity. g) Experimental measurements of VSL for channels with 30 × 26 µm array periodicity for varying incubation times, compared with the blank channel. h) VSL values obtained from the simulations for varying incubation times with 30 × 26 µm array periodicity. Data are shown as average ± standard deviation. The brackets represent a statistically significant difference compared with the groups using one‐way ANOVA with Tukey's posthoc test for multiple comparisons (n = 10–1700, N = 3, p < 0.05). n: number of sperm, N: number of experiments.
Figure 3
Figure 3
Analysis of sorted sperm motility, persistence, and recovery. a) Schematic illustrations of the sperm sorting process: semen is initially introduced into the device, allowed to incubate, and then output sperm are recovered and analyzed. Microscopy images of sperm trajectories traced using the CASA ImageJ plugin within the inlet, the pillar zone, and after collection from the outlet of the device are also shown (scale bars: 50 µm). b) Illustration of the persistent random walk (PRW) model parameters on a pillar array; S and L p denote sperm velocity and persistence length, respectively. c) Mean‐squared‐displacement (MSD) values of normal and morphologically defective sperm calculated using the multiscale model. d) Analysis of the persistence length, L p, values for normal and morphologically defective sperm calculated using the multiscale model. e) Experimental measurements of VCL for sperm and recovery efficiency at the outlet of SPARTAN for different channel lengths. f) Experimental measurements of VCL for sperm and recovery efficiency at the outlet of SPARTAN for various incubation times. Experimental data are shown as average ± standard deviation (n = 10–1600, N = 3). n: number of sperm, N: number of experiments.
Figure 4
Figure 4
Sperm morphological analysis. a) Microscopy images of Quick III‐stained sperm together with corresponding FESEM images illustrating several morphological defects: (i) normal, (ii) bent‐neck, and (iii) large‐head (scale bars: 10 µm). b) Microscopy images of Quick III‐stained raw semen (arrows show abnormal sperm) and sperm sorted using SPARTAN (scale bars: 50 µm). c) Morphology analysis (based Kruger's strict criteria) of raw semen, sperm processed through the swim‐up technique, the blank microfluidic channel (BMC), and SPARTAN. Data are shown as average ± standard deviation. The brackets represent a statistically significant difference compared with the groups using one‐way ANOVA with Tukey's posthoc test for multiple comparisons (n = 200; N = 3; p < 0.05). n: number of sperm, N: number of experiments. d,e) Sperm trajectories from the coarse‐grained MPCD simulations for the 30 × 26 µm pillar array periodicity: d) Sperm with a bent neck (0.1 π radians) make circles, preventing themselves from leaving the pillar array (scale bars: 200 µm); e) Sperm with a three times larger head diameter than normal get stuck and make sudden turns.
Figure 5
Figure 5
Analysis of sperm DNA integrity. a) Microscopy image of acidic aniline blue staining shows different stages of nuclear maturity of sperm. b) Nuclear maturity percentage of sperm sorted using SPARTAN compared with sperm processed by the swim‐up technique, and using the blank microfluidic channel (BMC). Comparison to raw semen sample is also shown (n = 5 semen samples). c–e) Fluorescence staining images of DNA fragmentation analysis using TUNNEL assay in raw semen, which is stained with Alexa 488 (green fluorescent), counter stained with 4′,6 diamidino‐2‐phylindole (DAPI) (blue fluorescent). f) Analysis of DNA fragmentation index (DFI) of two sperm samples (S1 and S2) sorted by SPARTAN compared with sperm processed by swim‐up technique and blank microfluidic channel (BMC). Comparison to raw semen sample is also shown (n = 44–353, N = 3). g) Sperm DNA global methylation level analysis of raw semen and sperm sorted by SPARTAN. Data are shown as average ± standard deviation. The brackets represent a statistically significant difference compared with the groups using one‐way ANOVA with Tukey's posthoc test for multiple comparisons (n = 200; N = 3; p < 0.05). n: number of sperm, N: number of experiments.

Similar articles

Cited by

References

    1. Agarwal A., Mulgund A., Hamada A., Chyatte M. R., Reprod. Biol. Endocrinol. 2015, 13, 37. - PMC - PubMed
    1. Turchi P., in Clinical Management of Male Infertility (Eds: Giorgio C., Giovanni B.), Springer International Publishing; 2015, pp. 5–11.
    1. Tasoglu S., Safaee H., Zhang X., Kingsley J. L., Catalano P. N., Gurkan U. A., Tüzel E., Demirci U., Small 2013, 9, 3374. - PMC - PubMed
    1. Ombelet W., Cooke I., Dyer S., Serour G., Devroey P., Hum. Reprod. Update 2008, 14, 605. - PMC - PubMed
    1. Henkel R. R., Schill W.‐B.. Reprod. Biol. Endocrinol. 2003, 1, 108. - PMC - PubMed