

Survey to Identify Substandard and Falsified Tablets in Several Asian Countries with Pharmacopeial Quality Control Tests and Principal Component Analysis of Handheld Raman Spectroscopy
- PMID: 29611498
- PMCID: PMC6086158
- DOI: 10.4269/ajtmh.17-0553
Survey to Identify Substandard and Falsified Tablets in Several Asian Countries with Pharmacopeial Quality Control Tests and Principal Component Analysis of Handheld Raman Spectroscopy
Abstract
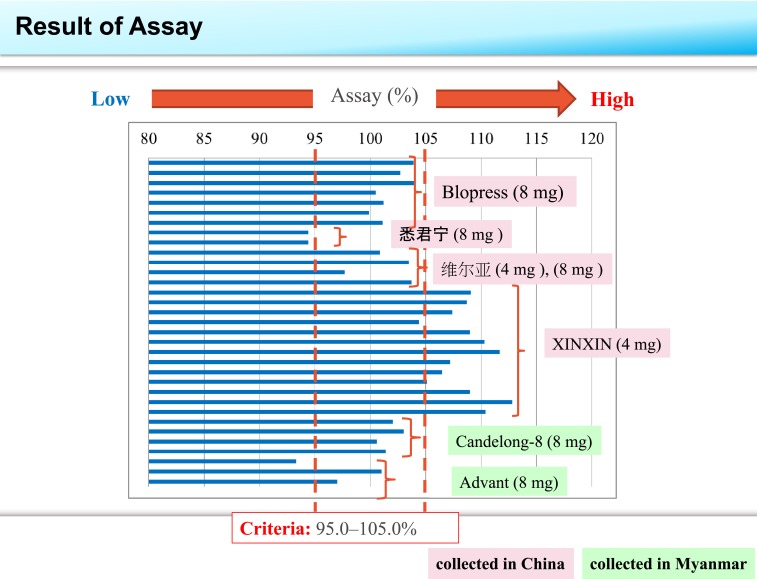
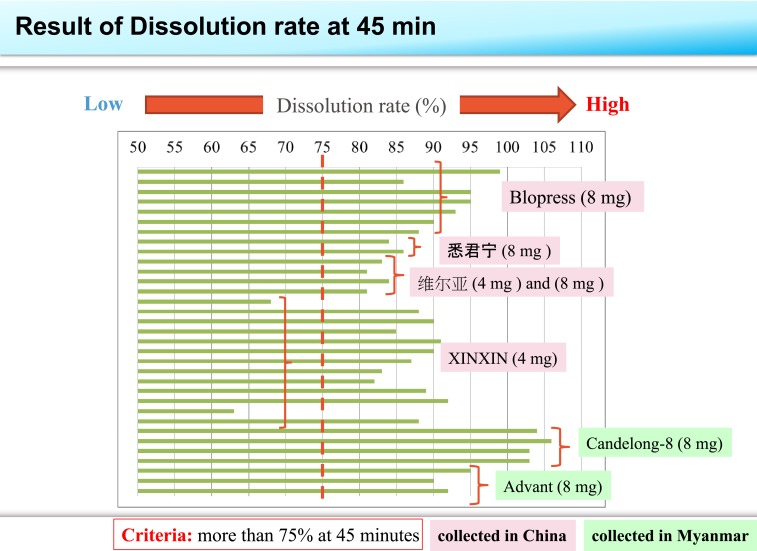
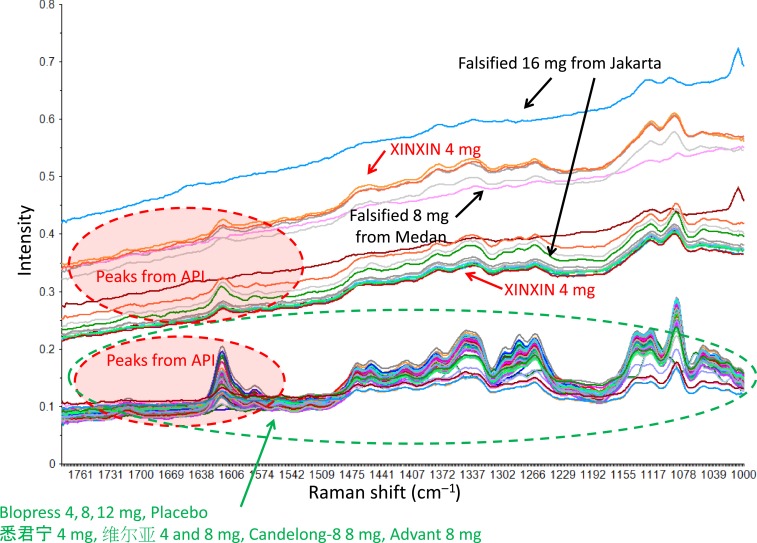
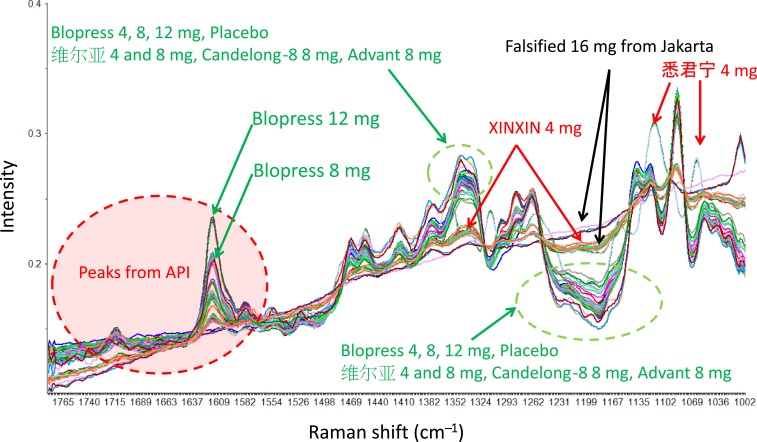
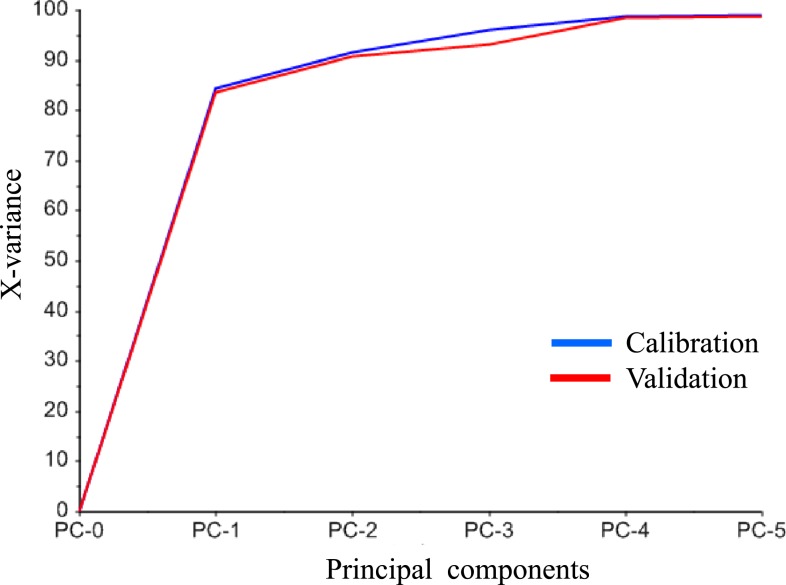
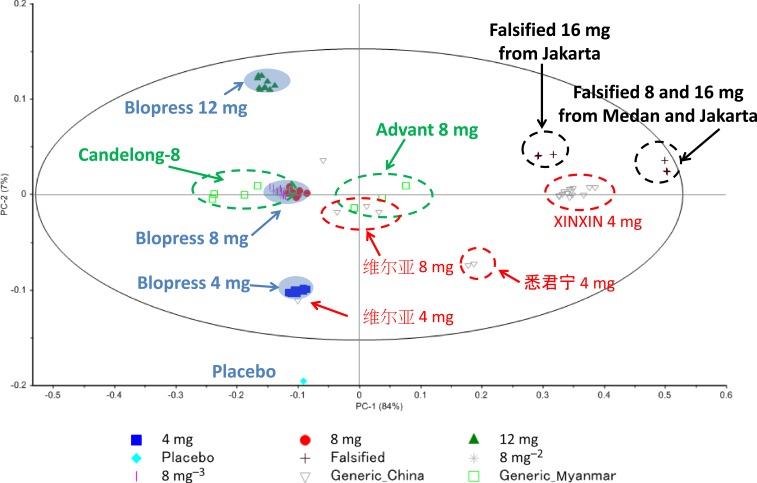
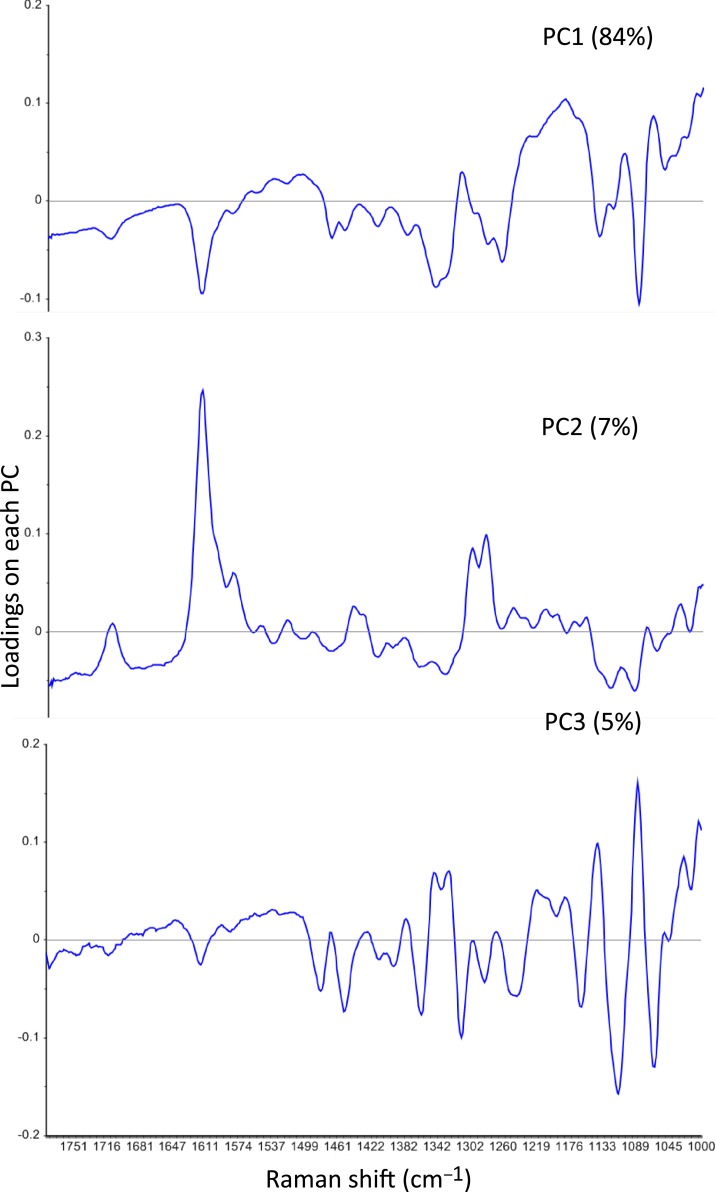
The World Health Organization has warned that substandard and falsified medical products (SFs) can harm patients and fail to treat the diseases for which they were intended, and they affect every region of the world, leading to loss of confidence in medicines, health-care providers, and health systems. Therefore, development of analytical procedures to detect SFs is extremely important. In this study, we investigated the quality of pharmaceutical tablets containing the antihypertensive candesartan cilexetil, collected in China, Indonesia, Japan, and Myanmar, using the Japanese pharmacopeial analytical procedures for quality control, together with principal component analysis (PCA) of Raman spectrum obtained with handheld Raman spectrometer. Some samples showed delayed dissolution and failed to meet the pharmacopeial specification, whereas others failed the assay test. These products appeared to be substandard. Principal component analysis showed that all Raman spectra could be explained in terms of two components: the amount of the active pharmaceutical ingredient and the kinds of excipients. Principal component analysis score plot indicated one substandard, and the falsified tablets have similar principal components in Raman spectra, in contrast to authentic products. The locations of samples within the PCA score plot varied according to the source country, suggesting that manufacturers in different countries use different excipients. Our results indicate that the handheld Raman device will be useful for detection of SFs in the field. Principal component analysis of that Raman data clarify the difference in chemical properties between good quality products and SFs that circulate in the Asian market.
Figures
References
-
- World Health Organization , 2017. Substandard and Falsified (SF) Medical Products. Available at: http://www.who.int/medicines/regulation/ssffc/en/. Accessed June 22, 2017.
-
- Hall KA, Newton PN, Green MD, De Veij M, Vandenaabele P, Pizzanelli D, Mayfong M, Dondorp A, Fernández F, 2006. Characterization of counterfeit artesunate antimalarial tablets from southeast Asia. Am J Trop Med Hyg 75: 804–811. - PubMed
-
- Security PG. A Serious Threat to Patient Safety, Counterfeit Pharmaceuticals. Available at: http://www.pfizer.com/files/products/CounterfeitBrochure.pdf. Accessed May 13, 2016.
-
- de Peinder P, Vredenbregt MJ, Visser T, de Kaste D, 2008. Detection of Lipitor® counterfeits: a comparison of NIR and Raman spectroscopy in combination with chemomertrics. J Pharm Biomed Anal 47: 688–694. - PubMed
-
- Lopes MB, Wolff J-C, 2009. Investigation into classification/sourcing of suspect counterfeit Heptodin™ tablets by near infrared chemical imaging. Anal Chim Acta 633: 149–155. - PubMed
Publication types
MeSH terms
Substances
LinkOut - more resources
Full Text Sources
Other Literature Sources
Medical
