. 2018 May 1;128(5):1873-1887.
doi: 10.1172/JCI97333. Epub 2018 Apr 3.

Galectin-9 inhibits TLR7-mediated autoimmunity in murine lupus models

Affiliations

Galectin-9 inhibits TLR7-mediated autoimmunity in murine lupus models

Santosh K Panda et al. J Clin Invest. .

Abstract

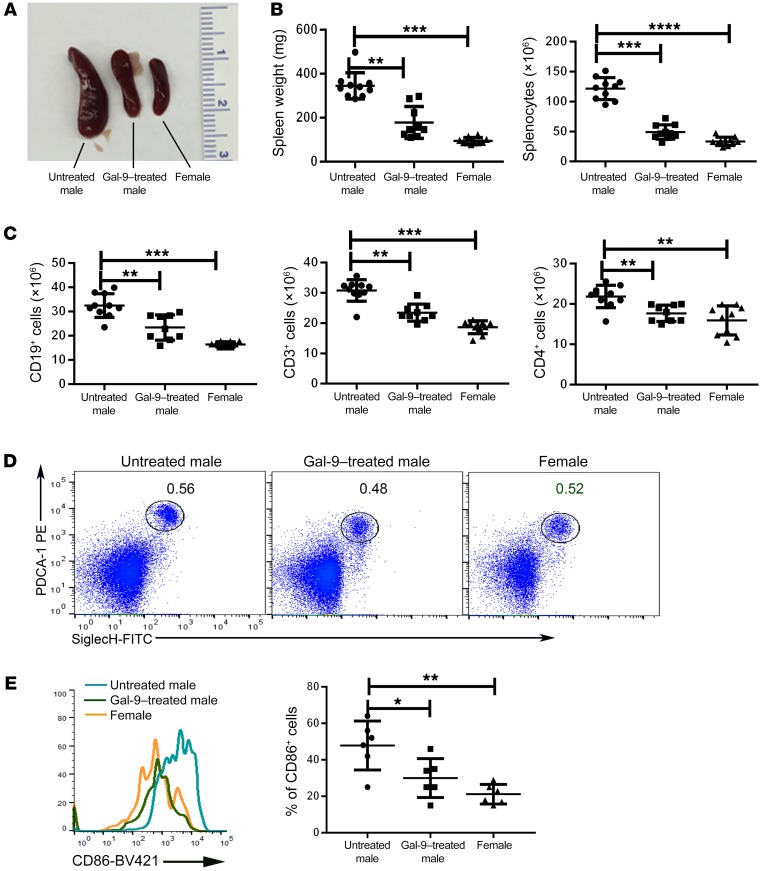
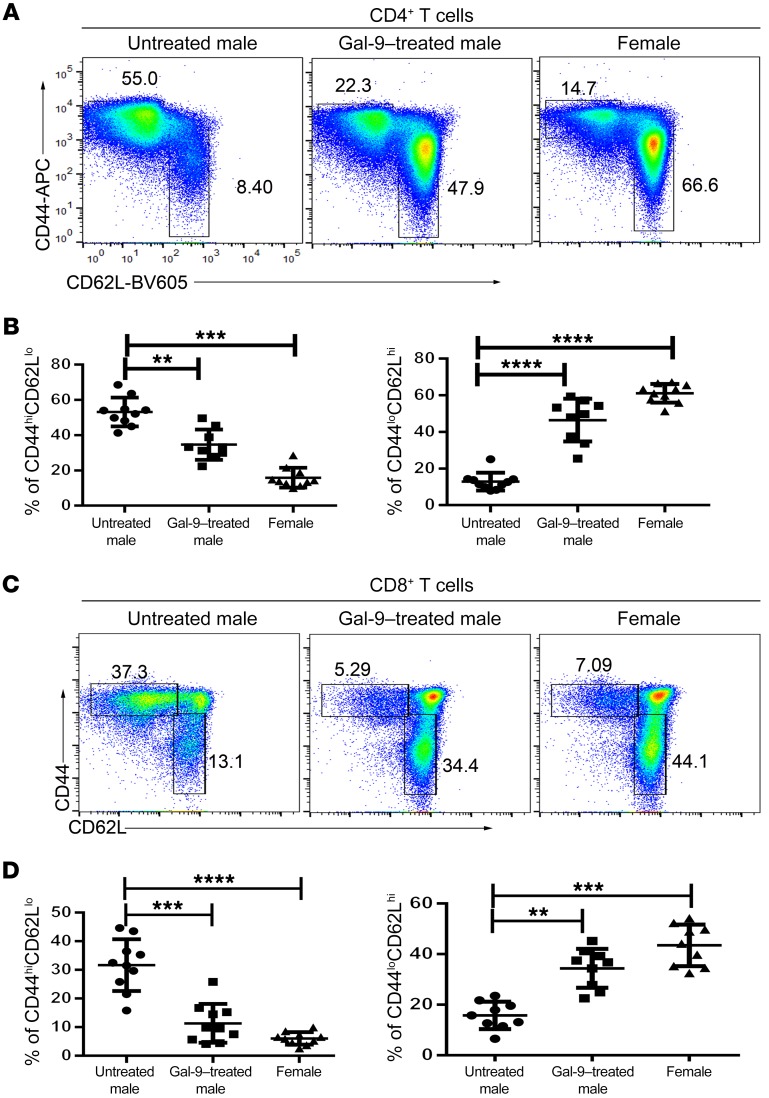
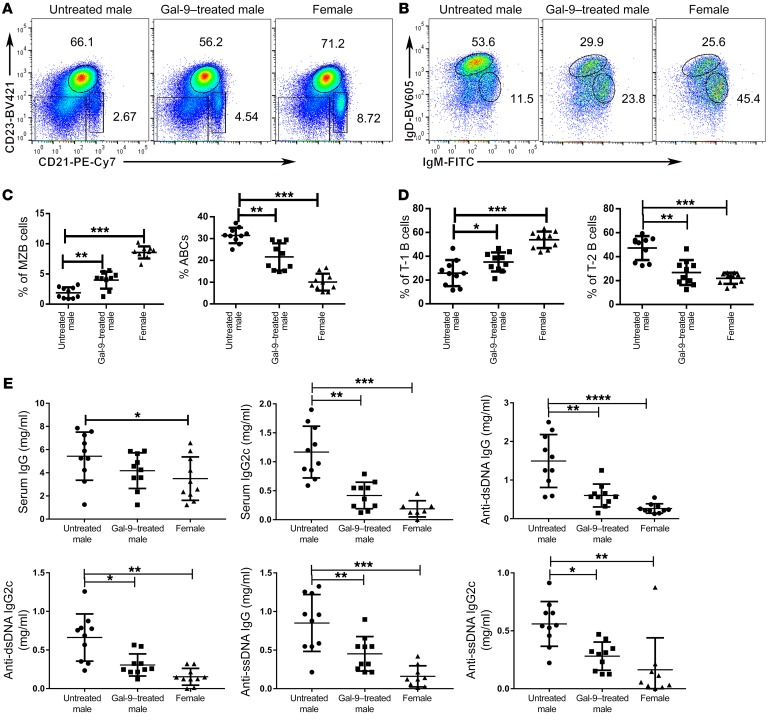
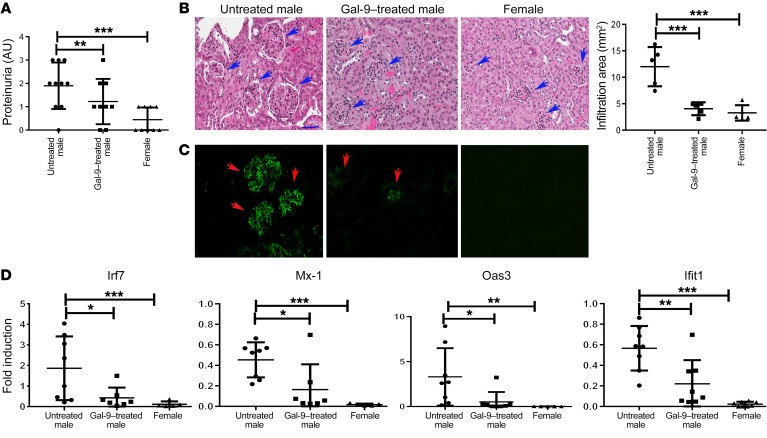
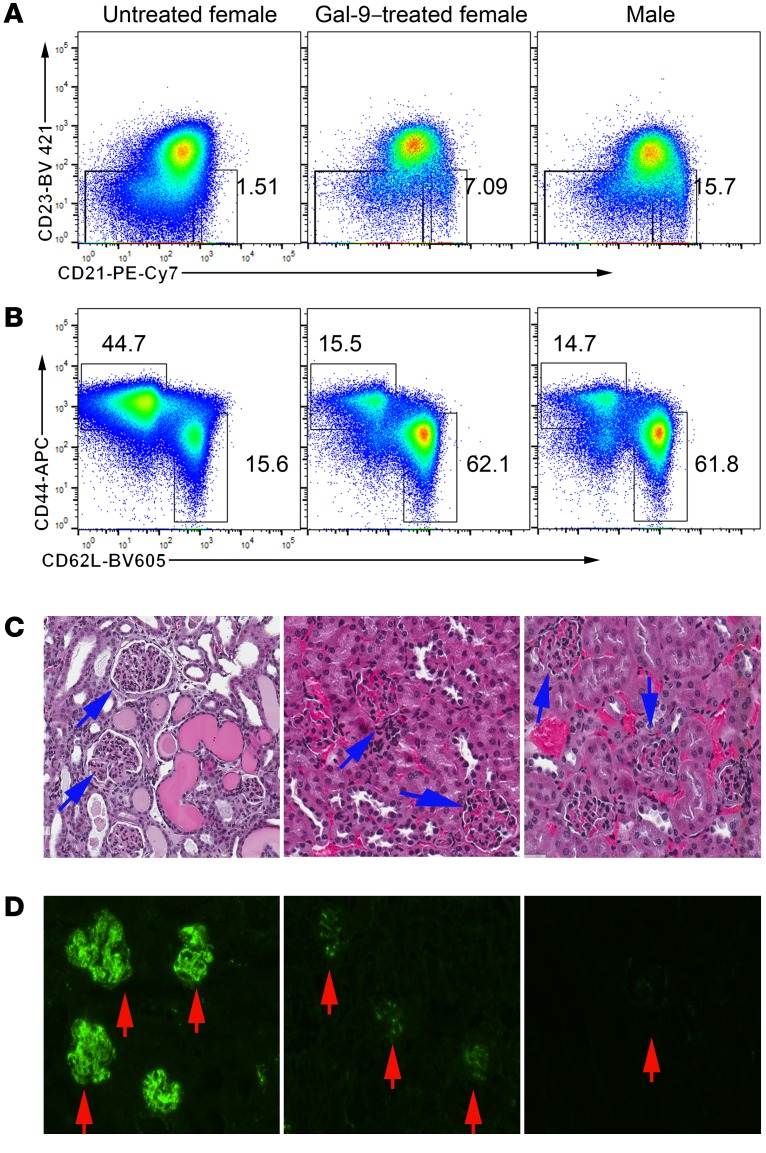
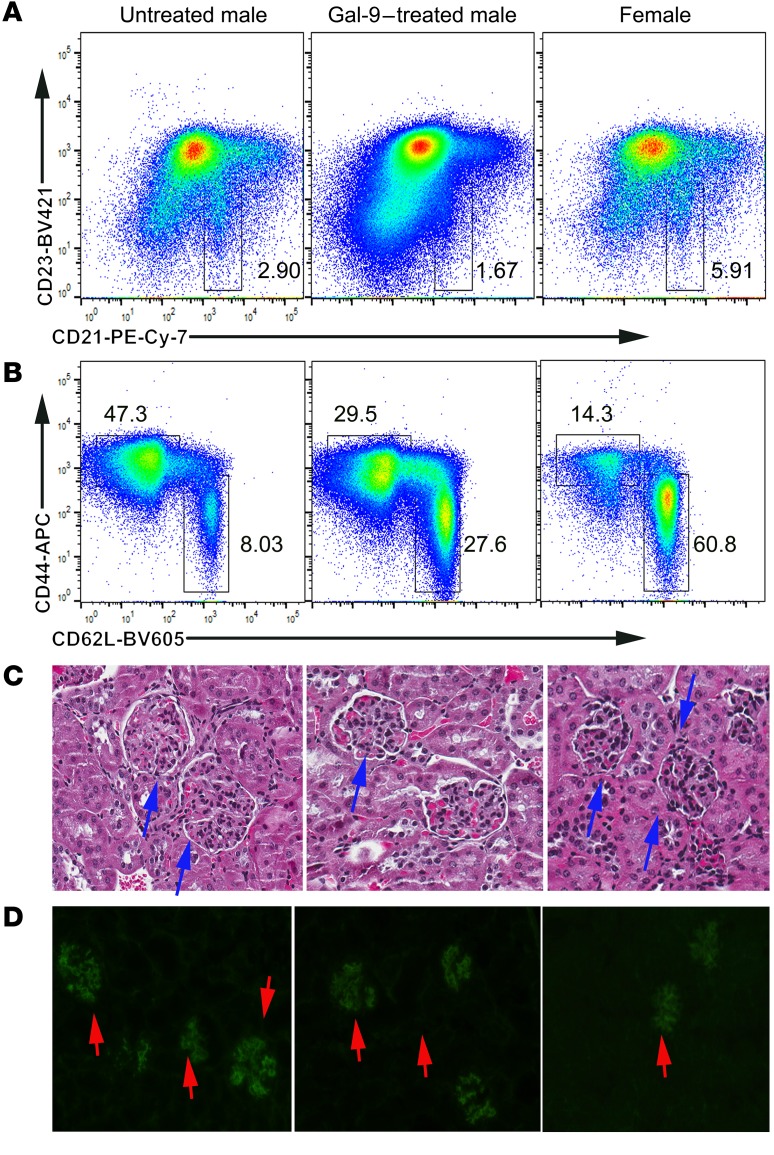
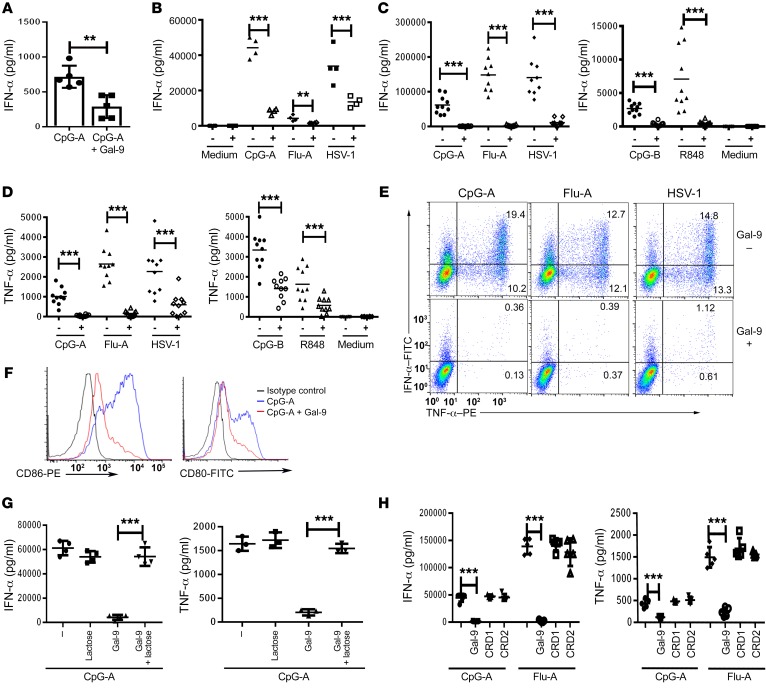
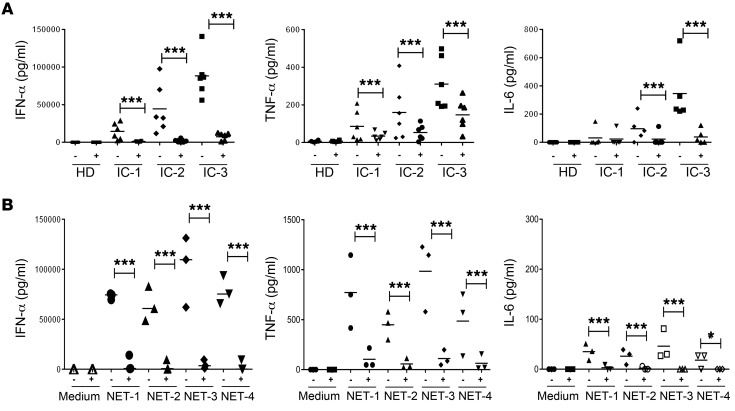
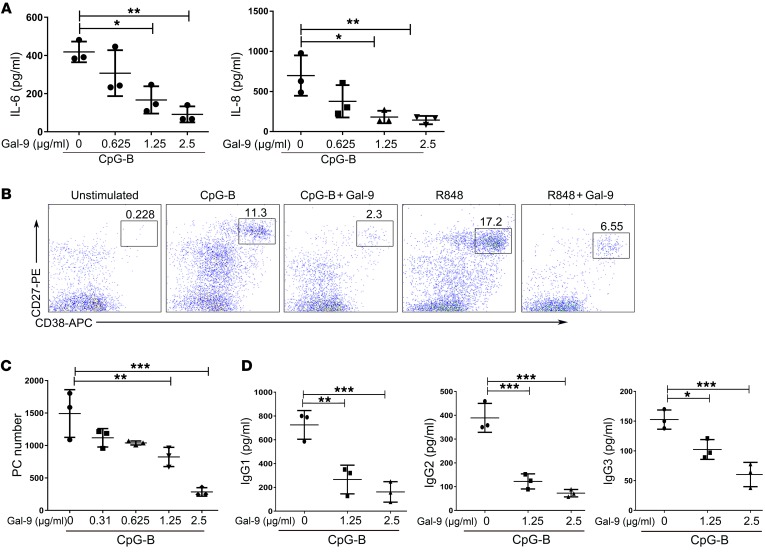
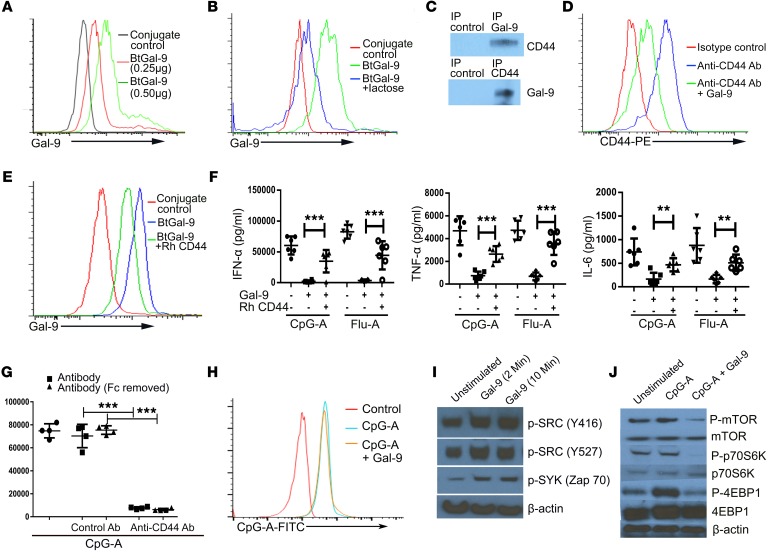
Uncontrolled secretion of type I IFN, as the result of endosomal TLR (i.e., TLR7 and TLR9) signaling in plasmacytoid DCs (pDCs), and abnormal production of autoantibodies by B cells are critical for systemic lupus erythematosus (SLE) pathogenesis. The importance of galectin-9 (Gal-9) in regulating various autoimmune diseases, including lupus, has been demonstrated. However, the precise mechanism by which Gal-9 mediates this effect remains unclear. Here, using spontaneous murine models of lupus (i.e., BXSB/MpJ and NZB/W F1 mice), we demonstrate that administration of Gal-9 results in reduced TLR7-mediated autoimmune manifestations. While investigating the mechanism underlying this phenomenon, we observed that Gal-9 inhibits the phenotypic maturation of pDCs and B cells and abrogates their ability to mount cytokine responses to TLR7/TLR9 ligands. Importantly, immunocomplex-mediated (IC-mediated) and neutrophil extracellular trap-mediated (NET-mediated) pDC activation was inhibited by Gal-9. Additionally, the mTOR/p70S6K pathway, which is recruited by both pDCs and B cells for TLR-mediated IFN secretion and autoantibody generation, respectively, was attenuated. Gal-9 was found to exert its inhibitory effect on both the cells by interacting with CD44.

Keywords: Autoimmune diseases; Immunology; Inflammation; Lupus.


Conflict of interest statement

Conflict of interest: RE and JLK are currently employees at and shareholders at Viela Bio.

Figures

Figure 1
Figure 1. Splenomegaly and hyperplasia in the spleens of male BXSB/MpJ mice are inhibited with Gal-9 treatment.
Male BXSB/MpJ mice were treated with Gal-9 from 8 to 18 weeks; the spleens were collected at 19 weeks and analyzed. (A) Representative images of the size of the spleens. (B) Histograms showing the weight of the spleens, the total number of splenocytes, (C) B cells (CD19+), T cells (CD3+), and T helper cells (CD4+). Data points represent individual mice. (D) Representative flow plots of pDC staining and the percentage of pDCs in the spleens of Gal-9–treated males and untreated male and female littermates. (E) A representative histogram of the expression of CD86 on pDCs and percentage of CD86-expressing pDCs of Gal-9–treated males, untreated males, and female littermates. Data are shown as mean ± SD. n = 10. Data are representative of 2 independent experiments. One-way ANOVA with Dunnett’s multiple comparison was used to test the statistical significance for all the data. For E, Kruskal-Wallis testing was performed, followed by Dunn’s test. *P < 0.05; **P < 0.01; ***P < 0.001 versus control; ****P < 0.0001.
Figure 2
Figure 2. Administration of Gal-9 impairs the expansion and activation of T cells.
Splenocytes from male BXSB/MpJ mice with and without Gal-9 treatment and female littermates of 19 weeks of age were analyzed. Representative flow cytometric figures of the expression of CD44 and CD62L on CD4+ T cells (A) and CD8+ T cells (C). Frequency of CD44hiCD62Llo and CD44loCD62Lhi cells on CD4+ T cells (B) and CD8+ T cells (D), as analyzed by flow cytometry. Data points represent individual mice. n = 10. Data are representative of 2 independent experiments and are shown as mean ± SD. One-way ANOVA with Dunnett’s multiple comparison was used to test statistical significance. *P < 0.05; **P < 0.01; ***P < 0.001 versus control; ****P < 0.0001.
Figure 3
Figure 3. Gal-9 administration inhibits ABC and T2B cell expansion, reconstitutes MZB and T1 B cells, and limits autoantibody generation in male BXSB/MpJ mice.
Splenocytes from Gal-9–treated male, untreated male, and age-matched female littermates were analyzed for expression of different markers on CD19+ B cells. (A) Representative flow plots of CD23 and CD21 expression on splenic B cells. (B) Frequency of CD23CD21hi MZB cells and CD23CD21AA4.1 ABCs were analyzed by FACS. (C) Representative graphs of (CD21, CD23, IgM+, and IgDlo) T1 cells and (CD21, CD23, IgM+, and IgDhi) T2 cells. (D) Frequency of T1 cells and T2 cells was analyzed by FACS. Data points represent individual mice. Data are shown as mean ± SD. (E) Serum of male BXSB/MpJ mice treated with Gal-9 along with untreated control and age-matched female littermates were analyzed for levels of IgG and IgG2c against nuclear autoantigens by ELISA. Data points represent individual mice. n = 10. Data are representative of 2 independent experiments and are shown as mean ± SD. One-way ANOVA with Dunnett’s multiple comparison was used to test the statistical significance for data presented in C and D, and Kruskal-Wallis testing was performed followed by Dunn’s test for E. *P < 0.05; **P < 0.01; ***P < 0.001 versus control; ****P < 0.0001.
Figure 4
Figure 4. Gal-9 administration ameliorates severity of kidney pathology.
Proteinuria of both Gal-9–treated and untreated control male BXSB/MpJ mice along with female littermates is shown (A) (n = 9). Formalin-fixed kidney sections from 19-week-old Gal-9–treated and untreated control male BXSB/MpJ mice along with female littermates were stained for H&E. Frozen kidney sections were stained for IgG. Representative images of 5 animals in each group (B and C). Individual glomeruli are marked with arrows. Original magnification, ×10. Relative expression of IFN-induced genes in kidney tissue was analyzed by reverse-transcriptase PCR (RT-PCR) (D). Data points indicate individual mice. Data are representative of 2 independent experiments. Kruskal-Wallis testing was performed, followed by Dunn’s test for statistical significance. *P < 0.05; **P < 0.01; ***P < 0.001 versus control.
Figure 5
Figure 5. Gal-9 administration reduces lupus pathogenesis in NZB/W F1 mice.
Splenocytes from Gal-9–treated female, untreated female, and age-matched male littermates of NZB/W F1 mice were analyzed for expression of different markers on CD19+ B cells and CD3+ T cells. (A) Representative flow cytometric plots of CD23 and CD21 expression on splenic B cells. (B) Representative flow cytometric plots of the expression of CD44 and CD62L on splenic CD4+ T cells. (C) Formalin-fixed kidney sections from 32-week-old Gal-9–treated and untreated control female along with male littermates were stained for H&E. (D) Frozen kidney sections were stained for IgG. Representative images of 5 animals in each group. Individual glomeruli are marked with arrows. Original magnification, ×10.
Figure 6
Figure 6. Therapeutic effects of Gal-9.
Splenocytes from Gal-9–treated male, untreated male, and age-matched female littermates of BXSB/MpJ mice were analyzed for expression of different markers on CD19+ B cells and CD3+ T cells. (A) Representative flow cytometric plots of CD23 and CD21 expression on splenic B cells. (B) Representative flow cytometric plots of the expression of CD44 and CD62L on splenic CD4+ T cells. (C) Formalin-fixed kidney sections from 19-week-old Gal-9–treated and untreated control male BXSB/MpJ mice along with female littermates were stained for H&E. (D) Frozen kidney sections were stained for IgG. Representative images of 5 animals in each group. Individual glomeruli are marked with arrows. Original magnification, ×10.
Figure 7
Figure 7. TLR-mediated pDC activation is inhibited by Gal-9.
Serum levels of IFN-α in CpG-A– or CpG-A and Gal-9–injected C57BL/6 mice. Data are shown as mean ± SD (n = 5). (B) Murine pDCs were stimulated with CpG-A, Flu-A, and HSV-1 with or without Gal-9 for 24 hours, and the culture supernatants were analyzed for levels of IFN-α (n = 4). (C and D) Human pDCs were stimulated with the TLR7 and TLR9 ligands CpG-A, Flu-A, HSV-1, CpG-B, and R848 in the presence or absence of recombinant human Gal-9, and culture supernatants were analyzed for IFN-α (C) and TNF-α (D). Data shown are mean of 10 independent experiments. (E) Intracellular expression of human pDCs after stimulation with CpG-A, Flu-A, and HSV-1 with or without Gal-9. Numbers in quadrants are the percentage of cells. (F) Surface expression of CD80 and CD86 was analyzed after stimulation of pDCs with CpG-A, with or without Gal-9. (G) Human pDCs were stimulated with CpG-A and Gal-9 in the presence or absence of lactose, and the culture supernatants were analyzed for IFN-α and TNF-α. (H) Human pDCs were stimulated with CpG-A, Flu-A Gal-9, CRD1, or CRD2 in various combinations, and culture supernatants were analyzed for IFN-α and TNF-α. Data are shown as mean ± SD of 5 independent experiments. Unpaired Student’s t test or Mann-Whitney U test with Welch’s correction was used to test statistical significance. **P < 0.01; ***P < 0.001 versus control without Gal-9.
Figure 8
Figure 8. Gal-9 inhibits the IC- and NET-induced production of IFN-α, TNF-α, and IL-6 by pDCs.
Human pDCs in the presence or absence of Gal-9 were stimulated with (A) IgG ICs isolated from the sera of SLE pediatric patients or (B) 30% culture supernatants from NET exposed to SLE-derived anti-RNP IgG. Culture supernatants were analyzed for IFN-α, TNF-α, and IL-6. Data shown are mean of 5 to 6 (A) and 3 (B) independent experiments without Gal-9. Unpaired Student’s t test or Mann-Whitney U test with Welch’s correction was used to test statistical significance. *P < 0.05; ***P < 0.001 versus control.
Figure 9
Figure 9. TLR7/TLR9-mediated B cell activation and differentiation are inhibited by Gal-9.
Human peripheral B cells were stimulated with CpG-B or R848 in the presence or absence of Gal-9 as indicated. After 48 hours, the culture supernatants were analyzed for levels of IL-6 and IL-8 (A). On day 7 following activation, PCs were quantified by flow cytometry, identified as CD19+/loCD27hiCD38hi cells. The number indicates percentage of PCs of total CD19+ B cell population (B). Total CD19+/lo IgD, CD27hi, CD38hi PC numbers (C) and IgG levels (D) were all determined after 7 days of culture. Data are representative of 3 independent donors. Mean ± SD of triplicate wells is shown. Kruskal-Wallis testing was performed, followed by Dunn’s test for statistical significance. *P < 0.05; **P < 0.01; ***P < 0.001 versus control without Gal-9.
Figure 10
Figure 10. Gal-9 inhibited mTOR pathway through CD44 in pDCs.
Human pDCs were incubated with different doses of biotinylated Gal-9 (BtGal-9), probed with avidin-FITC, and analyzed by FACS. (A) Representative overlaid histograms of different doses of biotinylated Gal-9 bound to the surface of pDCs. (B) pDCs were incubated with biotinylated Gal-9 with and without lactose, probed with avidin-FITC, and analyzed by FACS. (C) Gal-9–binding proteins from pDC lysates were immunoprecipitated and analyzed for the presence of CD44 (upper panel). CD44 was immunoprecipitated and analyzed for Gal-9 interaction in an immunoblot (lower panel). (D) Overlaid histograms of the binding of anti-CD44 antibodies to the surface of human pDCs with and without Gal-9. (E) Overlaid histograms of the binding of presaturated Gal-9 with CD44 recombinant protein (Rh CD44) to the surface of pDCs. Data are representative of 5 individual experiments. (F) Human pDCs were treated with either CpG-A or Flu-A with and without Gal-9 or presaturated Gal-9 with Rh CD44. Culture supernatants were analyzed for IFN-α, TNF-α, and IL-6. Mean ± SD for 6 independent experiments is shown. (G) Levels of IFN-α in supernatants of human pDCs treated with CpG-A, anti-CD44 antibodies, and control antibodies with and without Fc for 24 hours. Data are shown as the mean ± SD of 4 independent experiments. (H) Representative histogram showing CpG-A uptake by pDCs. Data are representative of 4 individual experiments. (I) Human primary pDCs were stimulated with Gal-9 for 2 and 10 minutes, and the cell lysates were analyzed by Western blotting. (J) Human primary pDCs were treated with CpG-A with or without Gal-9 for 15 minutes, and the cell lysates were analyzed by Western blotting. Data are representative of 5 independent experiments. Unpaired Student’s t test or Mann-Whitney U test with Welch’s correction was used to test the statistical significance. **P < 0.01; ***P < 0.001 versus control without Gal-9.

References

    1. Marshak-Rothstein A. Toll-like receptors in systemic autoimmune disease. Nat Rev Immunol. 2006;6(11):823–835. doi: 10.1038/nri1957. - DOI - PMC - PubMed
    1. Banchereau J, Pascual V. Type I interferon in systemic lupus erythematosus and other autoimmune diseases. Immunity. 2006;25(3):383–392. doi: 10.1016/j.immuni.2006.08.010. - DOI - PubMed
    1. Toong C, Adelstein S, Phan TG. Clearing the complexity: immune complexes and their treatment in lupus nephritis. Int J Nephrol Renovasc Dis. 2011;4:17–28. - PMC - PubMed
    1. Rönnblom L, Pascual V. The innate immune system in SLE: type I interferons and dendritic cells. Lupus. 2008;17(5):394–399. doi: 10.1177/0961203308090020. - DOI - PMC - PubMed
    1. Green NM, Marshak-Rothstein A. Toll-like receptor driven B cell activation in the induction of systemic autoimmunity. Semin Immunol. 2011;23(2):106–112. doi: 10.1016/j.smim.2011.01.016. - DOI - PMC - PubMed

MeSH terms