. 2018 Apr 3;14(4):e1006072.
doi: 10.1371/journal.pcbi.1006072. eCollection 2018 Apr.

Effect of Ca2+ on the promiscuous target-protein binding of calmodulin

Affiliations

Effect of Ca2+ on the promiscuous target-protein binding of calmodulin

Annie M Westerlund et al. PLoS Comput Biol. .

Abstract

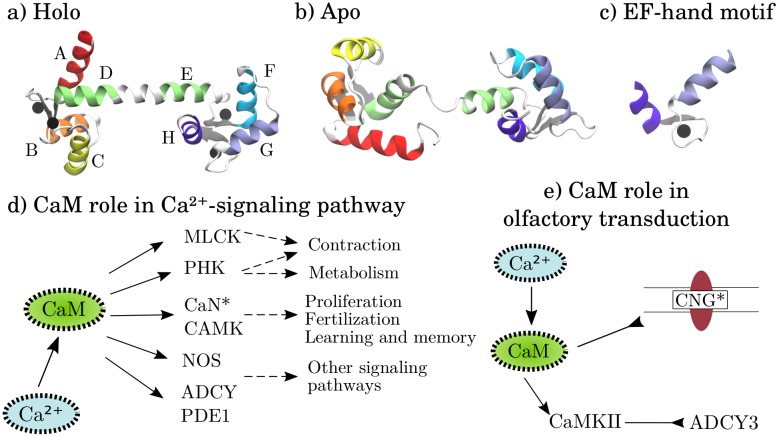
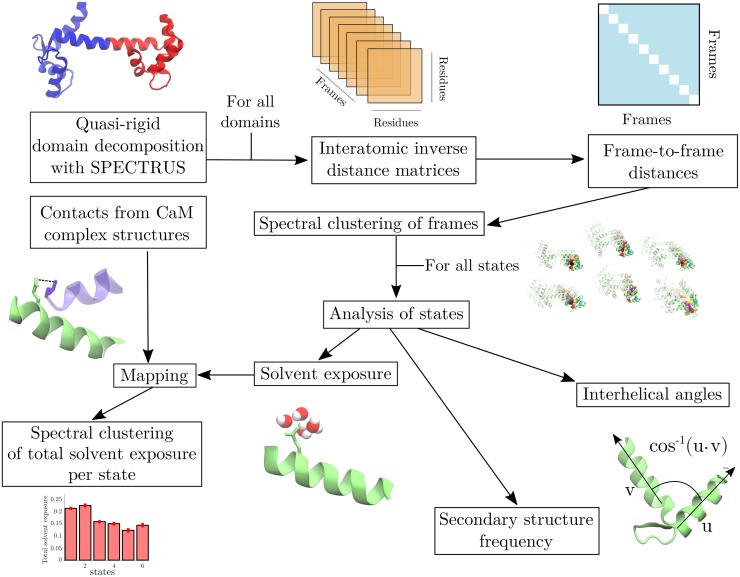
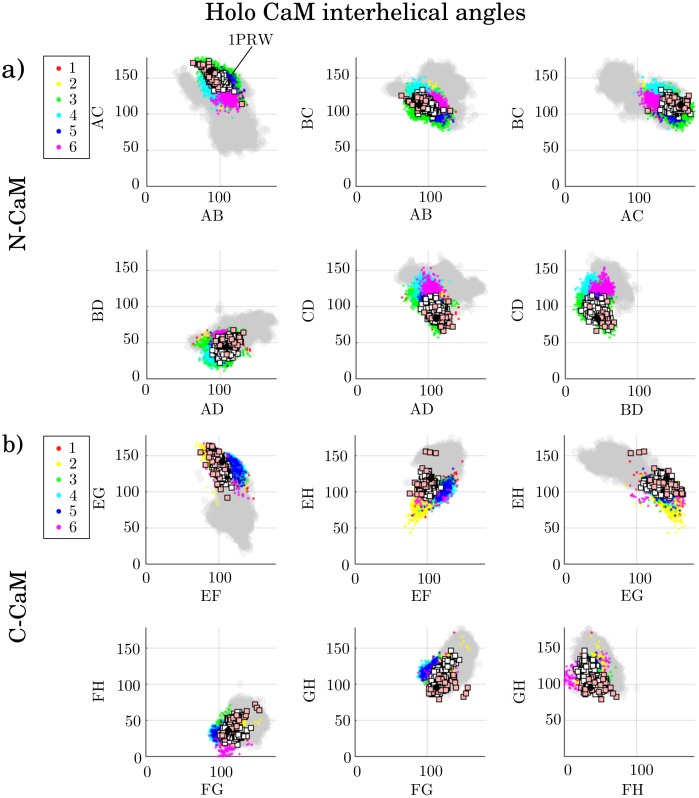
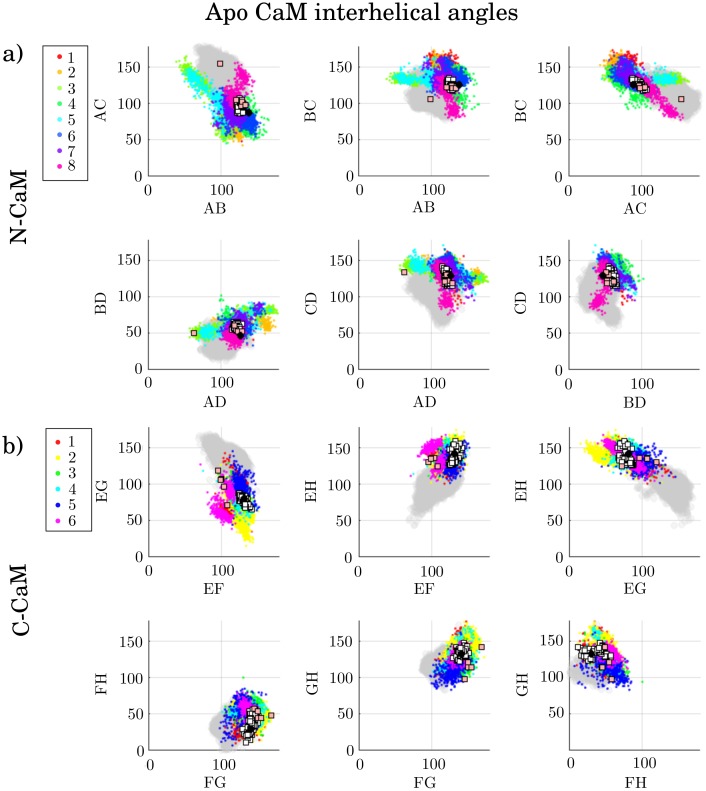
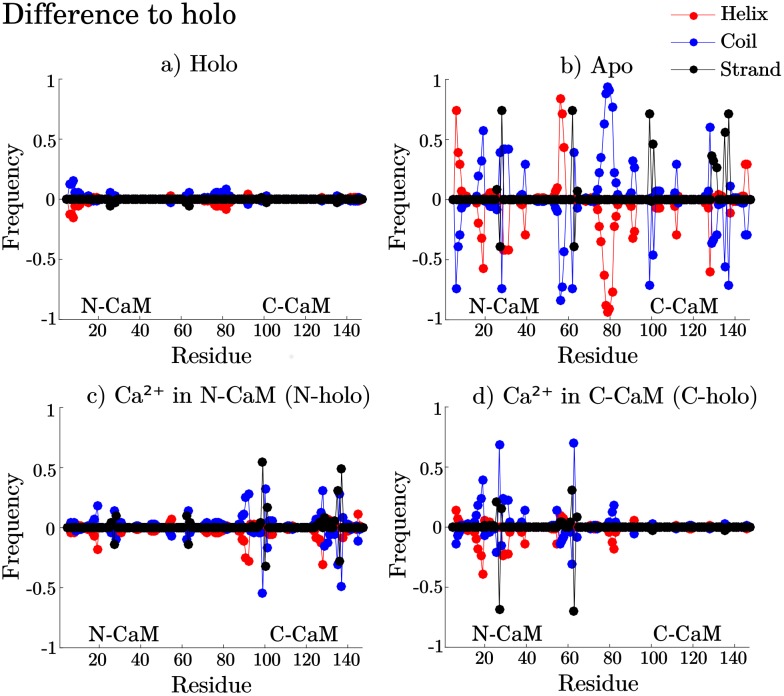
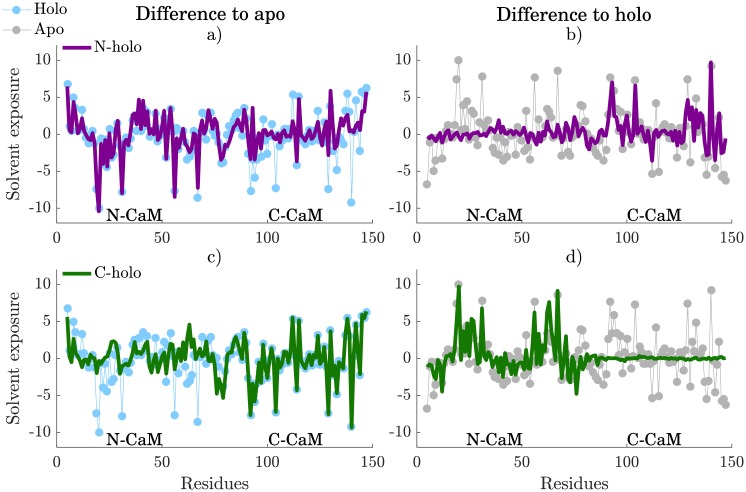
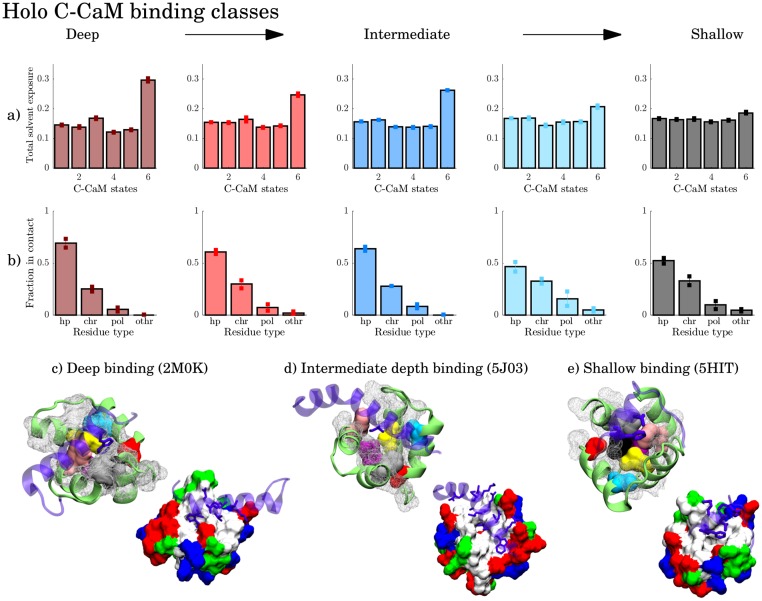
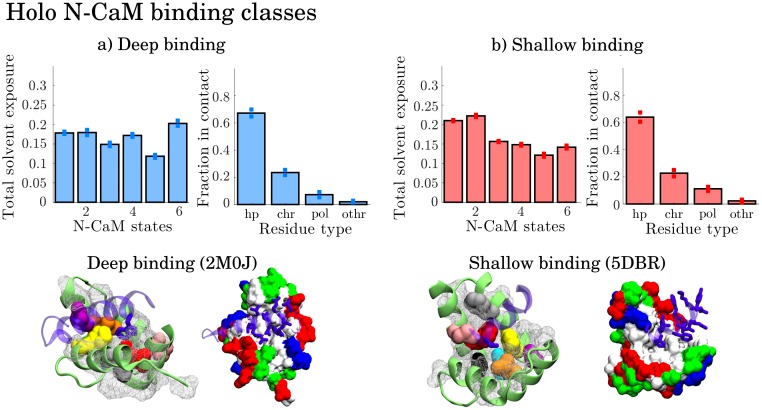
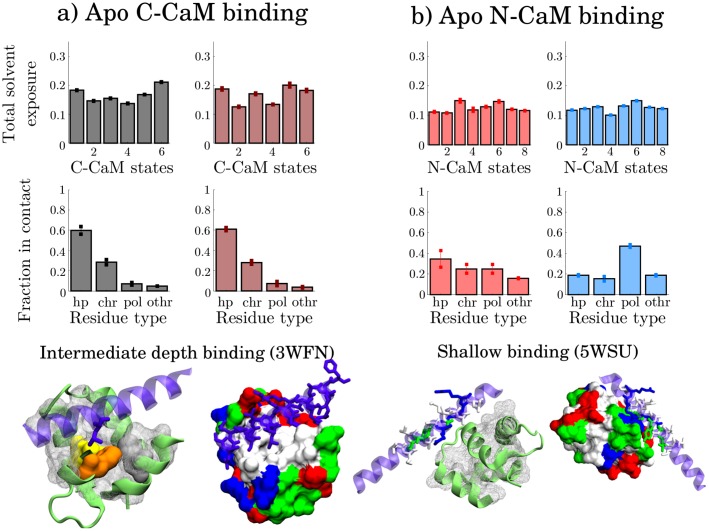
Calmodulin (CaM) is a calcium sensing protein that regulates the function of a large number of proteins, thus playing a crucial part in many cell signaling pathways. CaM has the ability to bind more than 300 different target peptides in a Ca2+-dependent manner, mainly through the exposure of hydrophobic residues. How CaM can bind a large number of targets while retaining some selectivity is a fascinating open question. Here, we explore the mechanism of CaM selective promiscuity for selected target proteins. Analyzing enhanced sampling molecular dynamics simulations of Ca2+-bound and Ca2+-free CaM via spectral clustering has allowed us to identify distinct conformational states, characterized by interhelical angles, secondary structure determinants and the solvent exposure of specific residues. We searched for indicators of conformational selection by mapping solvent exposure of residues in these conformational states to contacts in structures of CaM/target peptide complexes. We thereby identified CaM states involved in various binding classes arranged along a depth binding gradient. Binding Ca2+ modifies the accessible hydrophobic surface of the two lobes and allows for deeper binding. Apo CaM indeed shows shallow binding involving predominantly polar and charged residues. Furthermore, binding to the C-terminal lobe of CaM appears selective and involves specific conformational states that can facilitate deep binding to target proteins, while binding to the N-terminal lobe appears to happen through a more flexible mechanism. Thus the long-ranged electrostatic interactions of the charged residues of the N-terminal lobe of CaM may initiate binding, while the short-ranged interactions of hydrophobic residues in the C-terminal lobe of CaM may account for selectivity. This work furthers our understanding of the mechanism of CaM binding and selectivity to different target proteins and paves the way towards a comprehensive model of CaM selectivity.


Conflict of interest statement

The authors have declared that no competing interests exist.

Figures

Fig 1
Fig 1. The molecular structure of calmodulin and pathways where calmodulin acts as protein regulator.
Molecular structures of a) holo and b) apo calmodulin. The helices are marked according to their canonical labeling. Ca2+ ions are represented as black spheres and the beta sheets are marked with gray color. c) The EF-hand motif. d) The role of CaM in the Ca2+-signaling pathway. CaM activates the myosin light chain kinase IV (MLCK) and phosphorylase kinase (PHK), calcineurin (CaN), Ca2+/calmodulin-dependent protein kinase (CAMK), nitric oxide synthase 1 (NOS), adenylate cyclase 1 (ADCY) and phosphodiesterase 1A (PDE1). This affects downstream processes such as contraction, metabolism, proliferation, learning etc. e) The role of CaM in olfactory transduction. CaM inhibits the cyclic nucleotide-gated (CNG) channel and activates Ca2+/calmodulin-dependent protein kinase II (CaMKII). CaMKII then inhibits adenylate cyclase 3 (ADCY3). Proteins marked by a star are included in our CaM binding study. The pathways in d) and e) are adapted from KEGG [3].
Fig 2
Fig 2. Calmodulin C-term domain binding the voltage-gated sodium channel NaV1.2.
a) Ca2+-free state (apo) and b) Ca2+-bound state (holo). The structures have PDB accession numbers a) 2KXW and b) 4JPZ. The target protein backbone is shown as a violet ribbon and its side chains are depicted as violet sticks. Hydrophobic residues are visualized in a white mesh. Key hydrophobic residues found in this paper’s analysis are highlighted in different colors. The residues are shown in S1 and S3 Figs.
Fig 3
Fig 3. Flow chart of analysis methods.
The quasi-rigid domains of CaM were first identified. Then, interatomic inverse distance matrices were used to cluster the frames into states with spectral clustering. The states were analyzed by computing interhelical angles and secondary structure frequencies. Finally, the solvent exposure of each state was mapped to contacts formed in CaM structures, followed by a classification of binding modes with spectral clustering.
Fig 4
Fig 4. a) N-CaM and b) C-CaM states (clusters) projected onto interhelical angles of holo CaM, colored by their respective assigned cluster.
The gray dots correspond to the apo ensemble. The white squares are experimentally determined structures of protein-unbound holo CaM, while pink squares are experimentally determined structures of protein-bound holo CaM. The black circles respresent values of CaM interhelical angles inferred from NMR data [2, 24].
Fig 5
Fig 5. a) N-CaM and b) C-CaM states (clusters) projected onto interhelical angles of apo CaM, colored by their respective assigned cluster.
The gray dots correspond to the holo ensemble. The white squares are experimentally determined structures of protein-unbound apo CaM, while pink squares are experimentally determined structures of protein-bound apo CaM. The black circles represent values of CaM interhelical angles inferred from NMR data [2, 24].
Fig 6
Fig 6. Secondary structure frequency difference to holo for a) complete holo, b) C-holo, c) N-holo and d) apo ensembles.
Helix frequency is shown in red, strand in black and coil in blue. Above zero denotes gained secondary structure compared to holo while below shows the loss in secondary structure frequency.
Fig 7
Fig 7. Solvent exposure difference of N-holo (purple) and C-holo (green) to a, c) apo and b,d) holo.
The difference in solvent exposure to holo of both N-holo and C-holo are compared to the solvent exposure difference of apo (gray) to holo, while the difference in solvent exposure to apo of the two are compared to the solvent exposure difference of holo (blue) relative to apo.
Fig 8
Fig 8. Representative models from the three binding classes of holo C-CaM, with deep binding in c) olfactory cyclic nucleotide-gated ion channel (OLFp), intermediate binding in d) chimeric Kv7.2—Kv7.3 ion channel and shallow binding in e) EAG1 ion channel.
Color-highlighted residues are hydrophobic residues showing distinct signals in the contact-solvent exposure analysis. The other hydrophobic residues are shown by the white mesh. Associated to each class is a) the average total solvent exposure distribution per state and b) the average distribution of contact types formed in the CaM-complexes. The standard deviation is indicated on the bars.
Fig 9
Fig 9. Representative models from the two binding classes of holo N-CaM, with deep binding in a) olfactory cyclic nucleotide-gated ion channel (OLFp) and shallow binding in b) (human cardiac) Nav1.5 ion channel.
Color-highlighted residues are hydrophobic residues showing distinct signals in the contact-solvent exposure analysis. The other hydrophobic residues are shown by the white mesh. Associated to each class is the average total solvent exposure distribution per state (left) and the average distribution of contact types formed in the CaM-complexes (right). The standard deviation is indicated on the bars.
Fig 10
Fig 10. Representative models from the binding classes of apo C-CaM and N-CaM, with C-CaM intermediate binding to a) NaV1.6 ion channel and N-CaM shallow binding to b) Myosin VIIa.
Color-highlighted residues are hydrophobic residues showing distinct signals in the contact-solvent exposure analysis. The other hydrophobic residues are shown by the white mesh. Associated to each class is the average total solvent exposure distribution per state (upper row) and the average distribution of contact types formed in the CaM-complexes (lower row). The standard deviation is indicated on the bars.

References

    1. Stevens FC. Calmodulin: an introduction. Canadian Journal of Biochemistry and Cell Biology. 1983;61(8):906–910. doi: 10.1139/o83-115 - DOI - PubMed
    1. Kuboniwa H, Tjandra N, Grzesiek S, Ren H, Klee CB, Bax A. Solution structure of calcium-free calmodulin. Nature Structural & Molecular Biology. 1995;2(9):768–776. doi: 10.1038/nsb0995-768 - DOI - PubMed
    1. Kanehisa M, Furumichi M, Tanabe M, Sato Y, Morishima K. KEGG: new perspectives on genomes, pathways, diseases and drugs. Nucleic Acids Res. 2017;45(D1):D353–D361. doi: 10.1093/nar/gkw1092 - DOI - PMC - PubMed
    1. Smith DMA, Straatsma TP, Squier TC. Retention of Conformational Entropy upon Calmodulin Binding to Target Peptides Is Driven by Transient Salt Bridges. Biophysical Journal. 2012;103(7):1576–1584. doi: 10.1016/j.bpj.2012.08.037 - DOI - PMC - PubMed
    1. Rhoads AR, Friedberg F. Sequence motifs for calmodulin recognition. FASEB journal: official publication of the Federation of American Societies for Experimental Biology. 1997;11(5):331–340. doi: 10.1096/fasebj.11.5.9141499 - DOI - PubMed

Publication types

LinkOut - more resources