

Abundance, diversity and domain architecture variability in prokaryotic DNA-binding transcription factors
- PMID: 29614096
- PMCID: PMC5882156
- DOI: 10.1371/journal.pone.0195332
Abundance, diversity and domain architecture variability in prokaryotic DNA-binding transcription factors
Abstract
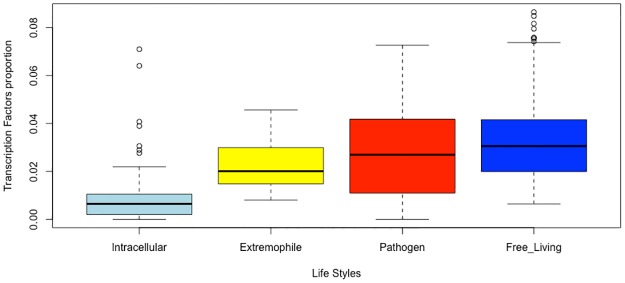
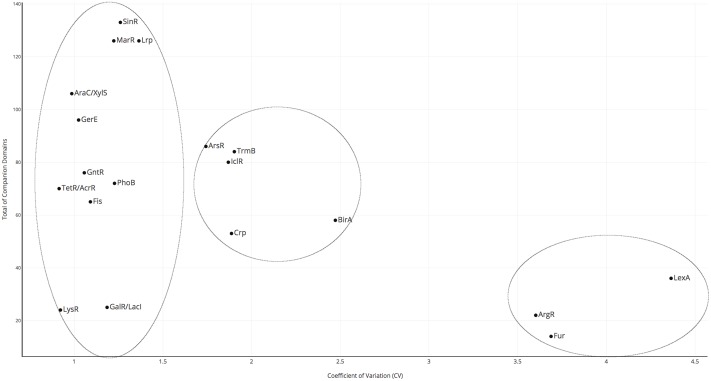
Gene regulation at the transcriptional level is a central process in all organisms, and DNA-binding transcription factors, known as TFs, play a fundamental role. This class of proteins usually binds at specific DNA sequences, activating or repressing gene expression. In general, TFs are composed of two domains: the DNA-binding domain (DBD) and an extra domain, which in this work we have named "companion domain" (CD). This latter could be involved in one or more functions such as ligand binding, protein-protein interactions or even with enzymatic activity. In contrast to DBDs, which have been widely characterized both experimentally and bioinformatically, information on the abundance, distribution, variability and possible role of the CDs is scarce. Here, we investigated these issues associated with the domain architectures of TFs in prokaryotic genomes. To this end, 19 families of TFs in 761 non-redundant bacterial and archaeal genomes were evaluated. In this regard we found four main groups based on the abundance and distribution in the analyzed genomes: i) LysR and TetR/AcrR; ii) AraC/XylS, SinR, and others; iii) Lrp, Fis, ArsR, and others; and iv) a group that included only two families, ArgR and BirA. Based on a classification of the organisms according to the life-styles, a major abundance of regulatory families in free-living organisms, in contrast with pathogenic, extremophilic or intracellular organisms, was identified. Finally, the protein architecture diversity associated to the 19 families considering a weight score for domain promiscuity evidenced which regulatory families were characterized by either a large diversity of CDs, here named as "promiscuous" families given the elevated number of variable domains found in those TFs, or a low diversity of CDs. Altogether this information helped us to understand the diversity and distribution of the 19 Prokaryotes TF families. Moreover, initial steps were taken to comprehend the variability of the extra domain in those TFs, which eventually might assist in evolutionary and functional studies.
Conflict of interest statement
Figures


References
-
- Engstrom MD, Pfleger BF. Transcription control engineering and applications in synthetic biology. Synth Syst Biotechnol. 2017;2(3):176–91 doi: 10.1016/j.synbio.2017.09.003 - DOI - PMC - PubMed
-
- Fernandez-Lopez R, Ruiz R, de la Cruz F, Moncalian G. Transcription factor-based biosensors enlightened by the analyte. Front Microbiol. 2015;6:648 doi: 10.3389/fmicb.2015.00648 - DOI - PMC - PubMed
-
- Balderas-Martinez YI, Savageau M, Salgado H, Perez-Rueda E, Morett E, Collado-Vides J. Transcription factors in Escherichia coli prefer the holo conformation. PLoS One. 2013;8(6):e65723 doi: 10.1371/journal.pone.0065723 - DOI - PMC - PubMed
-
- Martinez-Nunez MA, Poot-Hernandez AC, Rodriguez-Vazquez K, Perez-Rueda E. Increments and duplication events of enzymes and transcription factors influence metabolic and regulatory diversity in prokaryotes. PLoS One. 2013;8(7):e69707 doi: 10.1371/journal.pone.0069707 - DOI - PMC - PubMed
Publication types
MeSH terms
Substances
LinkOut - more resources
Full Text Sources
Other Literature Sources
Miscellaneous
