. 2018 Apr 3;319(13):1351-1361.
doi: 10.1001/jama.2018.2151.

Association of Solid Fuel Use With Risk of Cardiovascular and All-Cause Mortality in Rural China

Affiliations

Association of Solid Fuel Use With Risk of Cardiovascular and All-Cause Mortality in Rural China

Kuai Yu et al. JAMA. .

Abstract

Importance: When combusted indoors, solid fuels generate a large amount of pollutants such as fine particulate matter.

Objective: To assess the associations of solid fuel use for cooking and heating with cardiovascular and all-cause mortality.

Design, setting, and participants: This nationwide prospective cohort study recruited participants from 5 rural areas across China between June 2004 and July 2008; mortality follow-up was until January 1, 2014. A total of 271 217 adults without a self-reported history of physician-diagnosed cardiovascular disease at baseline were included, with a random subset (n = 10 892) participating in a resurvey after a mean interval of 2.7 years.

Exposures: Self-reported primary cooking and heating fuels (solid: coal, wood, or charcoal; clean: gas, electricity, or central heating), switching of fuel type before baseline, and use of ventilated cookstoves.

Main outcomes and measures: Death from cardiovascular and all causes, collected through established death registries.

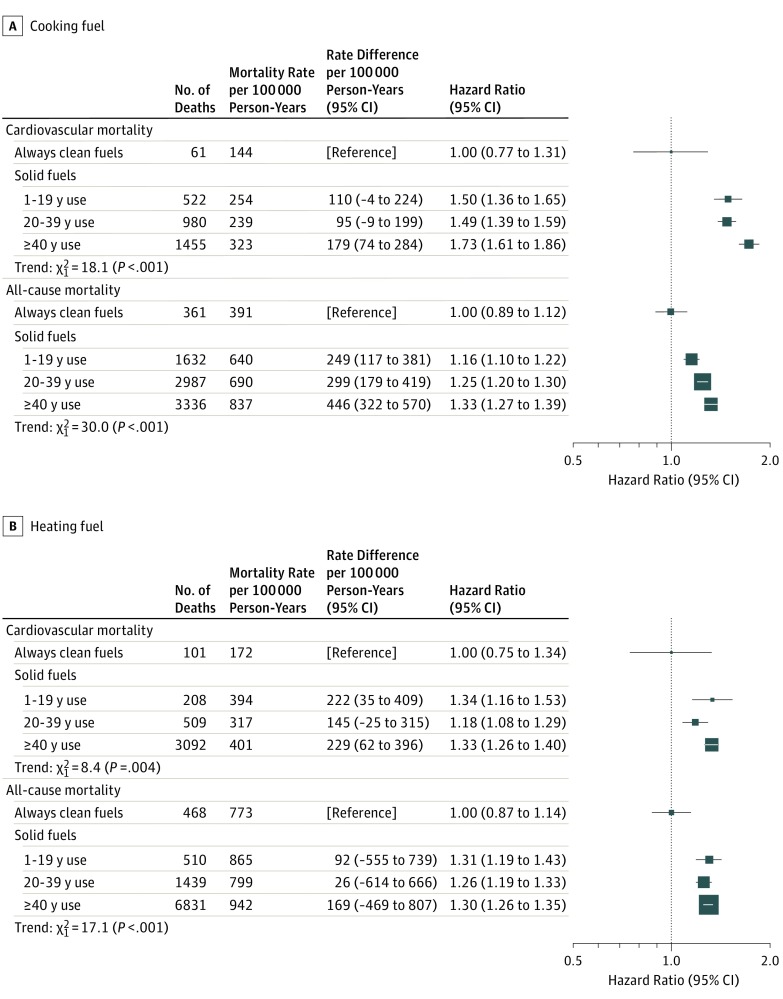
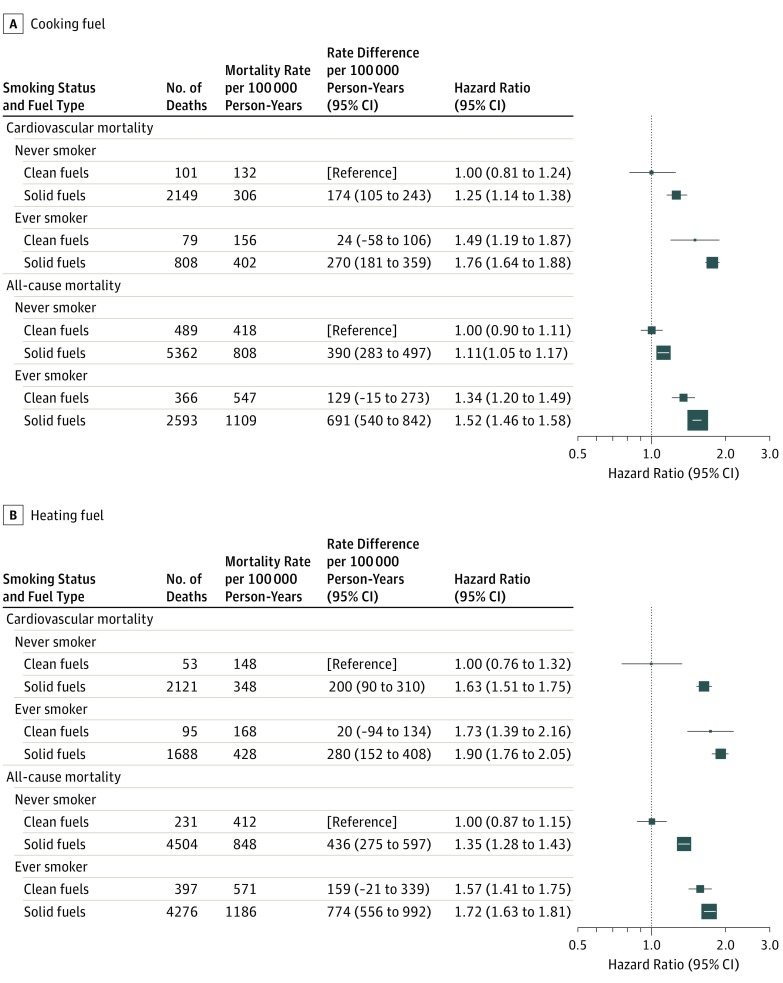
Results: Among the 271 217 participants, the mean (SD) age was 51.0 (10.2) years, and 59% (n = 158 914) were women. A total of 66% (n = 179 952) of the participants reported regular cooking (at least weekly) and 60% (n = 163 882) reported winter heating, of whom 84% (n = 150 992) and 90% (n = 147 272) used solid fuels, respectively. There were 15 468 deaths, including 5519 from cardiovascular causes, documented during a mean (SD) of 7.2 (1.4) years of follow-up. Use of solid fuels for cooking was associated with greater risk of cardiovascular mortality (absolute rate difference [ARD] per 100 000 person-years, 135 [95% CI, 77-193]; hazard ratio [HR], 1.20 [95% CI, 1.02-1.41]) and all-cause mortality (ARD, 338 [95% CI, 249-427]; HR, 1.11 [95% CI, 1.03-1.20]). Use of solid fuels for heating was also associated with greater risk of cardiovascular mortality (ARD, 175 [95% CI, 118-231]; HR, 1.29 [95% CI, 1.06-1.55]) and all-cause mortality (ARD, 392 [95% CI, 297-487]; HR, 1.14 [95% CI, 1.03-1.26]). Compared with persistent solid fuel users, participants who reported having previously switched from solid to clean fuels for cooking had a lower risk of cardiovascular mortality (ARD, 138 [95% CI, 71-205]; HR, 0.83 [95% CI, 0.69-0.99]) and all-cause mortality (ARD, 407 [95% CI, 317-497]; HR, 0.87 [95% CI, 0.79-0.95]), while for heating, the ARDs were 193 (95% CI, 128-258) and 492 (95% CI, 383-601), and the HRs were 0.57 (95% CI, 0.42-0.77) and 0.67 (95% CI, 0.57-0.79), respectively. Among solid fuel users, use of ventilated cookstoves was also associated with lower risk of cardiovascular mortality (ARD, 33 [95% CI, -9 to 75]; HR, 0.89 [95% CI, 0.80-0.99]) and all-cause mortality (ARD, 87 [95% CI, 20-153]; HR, 0.91 [95% CI, 0.85-0.96]).

Conclusions and relevance: In rural China, solid fuel use for cooking and heating was associated with higher risks of cardiovascular and all-cause mortality. These risks may be lower among those who had previously switched to clean fuels and those who used ventilation.


Conflict of interest statement

Conflict of Interest Disclosures: All authors have completed and submitted the ICMJE Form for Disclosure of Potential Conflicts of Interest and none were reported.

Figures

Figure 1.
Figure 1.. Adjusted Hazard Ratios for Cardiovascular and All-Cause Mortality According to Long-term Solid Fuel Use for Cooking and Heating
For cooking-related analysis, participants who switched from solid to clean fuels at baseline (n = 15 475) were excluded, leaving 162 076 for the analysis. The numbers of participants (and person-years) included in the 4 categories (from always clean to always solid [≥40 years]) were 11 084 (82 206), 41 171 (304 674), 76 072 (553 267), and 33 749 (240 044), respectively. For heating-related analysis, participants who switched from solid to clean fuels at baseline (n = 5757) were excluded, leaving 156 332 for the analysis. The numbers of participants (and person-years) included in the 4 categories (from always clean to always solid [≥40 years]) were 9060 (61 981), 8292 (59 486), 45 460 (333 602), and 93 520 (667 071), respectively. The mortality rate per 100 000 person-years was adjusted for age, sex, and study areas, and the rate difference was calculated as the adjusted mortality rate of the exposed group minus that of the reference group. Hazard ratios were stratified according to age at risk, sex, and study areas, and adjusted for education level, income, alcohol consumption, smoking status, passive smoking, physical activity, body mass index, diet (consumption of fresh fruit, preserved vegetables, meat, fish, dairy, rice, poultry, and eggs), cookstove ventilation, and cooking and heating exposures, where appropriate. The floating absolute risk method provides the variance of the logarithm of the hazard ratio for each category (including the reference category) to facilitate comparisons across the different exposure categories. The boxes represent hazard ratios, with the size inversely proportional to the variance of the logarithm of the hazard ratio, and the horizontal lines represent 95% CIs.
Figure 2.
Figure 2.. Adjusted Hazard Ratios for Cardiovascular and All-Cause Mortality According to Fuel Used for Cooking and Heating in Never and Ever Smokers
In the analyses of fuel use for cooking, this study further excluded 2401 participants who reported unspecified fuel use and 91 265 noncooking participants, leaving 177 551 participants for the analysis. The numbers of participants (and person-years) included in the 4 categories (never smoker, clean fuels; never smoker, solid fuels; ever smoker, clean fuels; and ever smoker, solid fuels) were 20 462 (151 563), 127 601 (931 784), 6097 (43 829), and 23 391 (166 201), respectively. The relative excess risk due to interaction was 0.05 (95% CI, 0.03-0.07) for cardiovascular mortality and 0.04 (95% CI, 0.02-0.05) for all-cause mortality. In the analyses of fuel use for heating, this study excluded participants from Zhejiang (n = 56 813) where heating was rarely reported (0.6%), those who reported nonheating (n = 50 522), and those who reported unspecified fuel use (n = 1793), leaving 162 089 participants for the analysis. The corresponding numbers of participants (and person-years) were 9412 (66 552), 98 640 (714 999), 5405 (37 308), and 48 632 (345 160), respectively. The mortality rate per 100 000 person-years was adjusted for age, sex, and study areas, and the rate difference was calculated as the adjusted mortality rate of the exposed group minus that of the reference group. The relative excess risk due to interaction was 0.03 (95% CI, 0.00-0.06) for cardiovascular mortality and −0.02 (95% CI, −0.05 to 0.01) for all-cause mortality. Hazard ratios were stratified according to age at risk, sex, and study areas, and adjusted for education level, income, alcohol consumption, smoking status, passive smoking, physical activity, body mass index, diet (consumption of fresh fruit, preserved vegetables, meat, fish, dairy, rice, poultry, and eggs), cookstove ventilation, and cooking and heating exposures. The floating absolute risk method provides the variance of the logarithm of the hazard ratio for each category (including the reference category) to facilitate comparisons across the different exposure categories. The boxes represent hazard ratios, with the size inversely proportional to the variance of the logarithm of the hazard ratio, and the horizontal lines represent 95% CIs.

References

    1. International Energy Agency World Energy Outlook 2016. Paris, France: International Energy Agency; 2016.
    1. Clark ML, Peel JL, Balakrishnan K, et al. . Health and household air pollution from solid fuel use: the need for improved exposure assessment. Environ Health Perspect. 2013;121(10):1120-1128. - PMC - PubMed
    1. Gordon SB, Bruce NG, Grigg J, et al. . Respiratory risks from household air pollution in low and middle income countries. Lancet Respir Med. 2014;2(10):823-860. - PMC - PubMed
    1. GBD 2016 Risk Factors Collaborators Global, regional, and national comparative risk assessment of 84 behavioural, environmental and occupational, and metabolic risks or clusters of risks, 1990-2016: a systematic analysis for the Global Burden of Disease Study 2016. Lancet. 2017;390(10100):1345-1422. - PMC - PubMed
    1. Fatmi Z, Coggon D. Coronary heart disease and household air pollution from use of solid fuel: a systematic review. Br Med Bull. 2016;118(1):91-109. - PMC - PubMed

Publication types