

Pharmacokinetic/pharmacodynamic modeling of combination-chemotherapy for lung cancer
- PMID: 29614265
- PMCID: PMC5958901
- DOI: 10.1016/j.jtbi.2018.03.035
Pharmacokinetic/pharmacodynamic modeling of combination-chemotherapy for lung cancer
Abstract
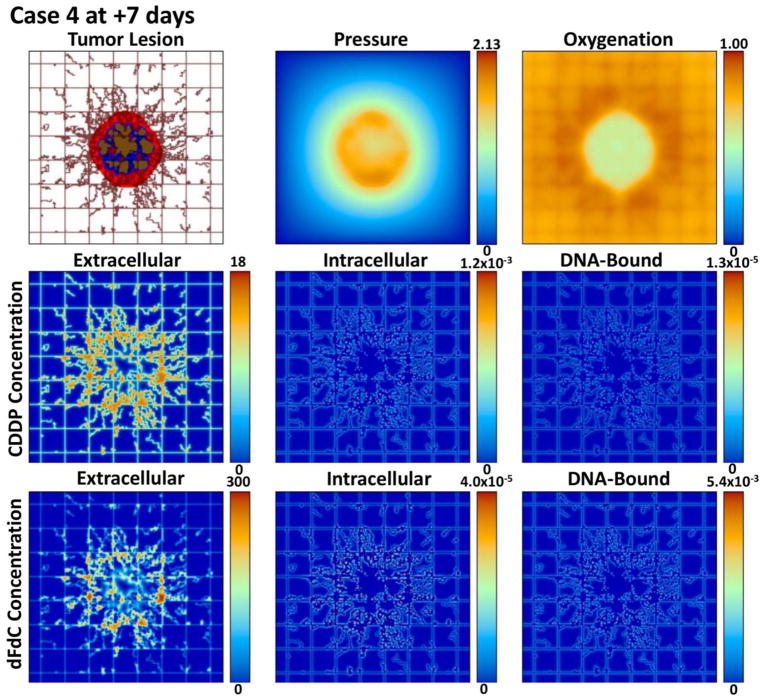
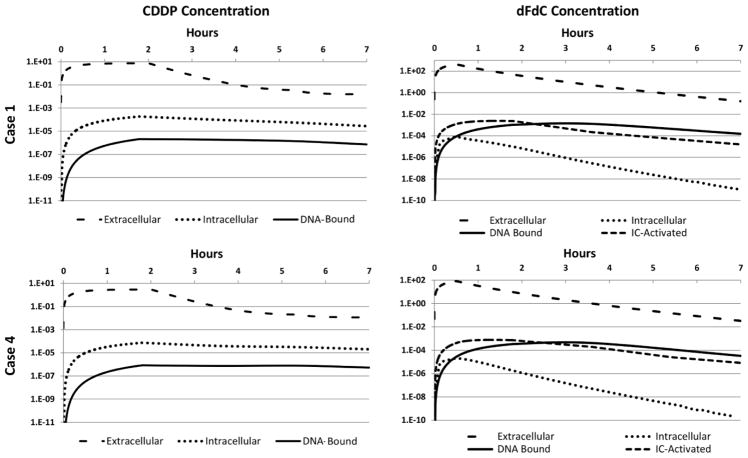
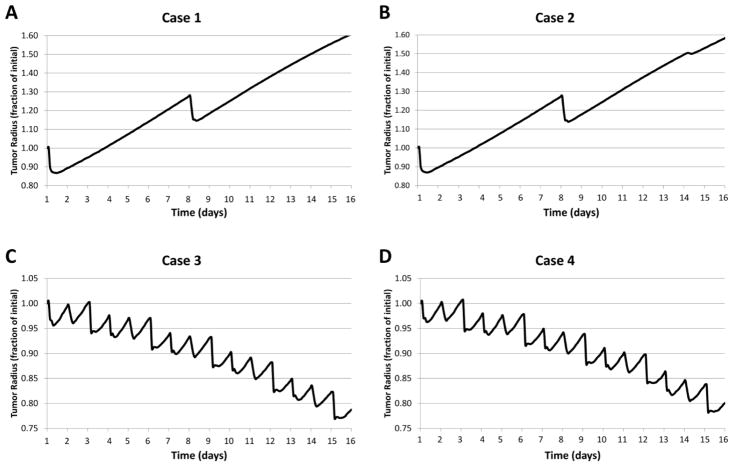
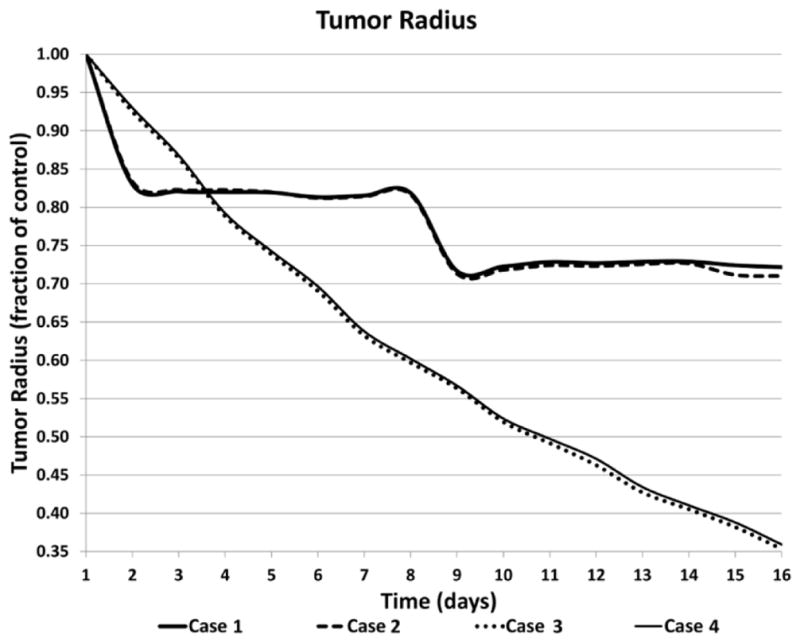
Chemotherapy for non-small cell lung cancer (NSCLC) typically involves a doublet regimen for a number of cycles. For any particular patient, a course of treatment is usually chosen from a large number of combinational protocols with drugs in concomitant or sequential administration. In spite of newer drugs and protocols, half of patients with early disease will live less than five years and 95% of those with advanced disease survive for less than one year. Here, we apply mathematical modeling to simulate tumor response to multiple drug regimens, with the capability to assess maximum tolerated dose (MTD) as well as metronomic drug administration. We couple pharmacokinetic-pharmacodynamic intracellular multi-compartment models with a model of vascularized tumor growth, setting input parameters from in vitro data, and using the models to project potential response in vivo. This represents an initial step towards the development of a comprehensive virtual system to evaluate tumor response to combinatorial drug regimens, with the goal to more efficiently identify optimal course of treatment with patient tumor-specific data. We evaluate cisplatin and gemcitabine with clinically-relevant dosages, and simulate four treatment NSCLC scenarios combining MTD and metronomic therapy. This work thus establishes a framework for systematic evaluation of tumor response to combination chemotherapy. The results with the chosen parameter set indicate that although a metronomic regimen may provide advantage over MTD, the combination of these regimens may not necessarily offer improved response. Future model evaluation of chemotherapy possibilities may help to assess their potential value to obtain sustained NSCLC regression for particular patients, with the ultimate goal of optimizing multiple-drug chemotherapy regimens in clinical practice.
Keywords: Combination chemotherapy; Gemcitabine and cisplatin; Lung cancer; Mathematical modeling and computational simulation; Pharmacokinetics and pharmacodynamics.
Copyright © 2018 Elsevier Ltd. All rights reserved.
Figures
References
-
- Administration, F. a. D, editor. PLATINOL® (cisplatin for injection, USP) Bristol-Myers Squibb Company; 2010.
-
- Society, A. C, editor. Non-Small Cell Lung Cancer Survival Rates, by Stage. 2017
-
- Akcali Z, Calikusu Z, Sakalli H, Ozyilkan O. Gemcitabine and cisplatin treatment of advanced-stage non-small-cell lung cancer in patients given cisplatin on day 8. Tumori. 2008;94:474–80. - PubMed
-
- André N, Barbolosi D, Billy F, Cahpuisat G, Hubert F, Grenier E, Rovini A. Mathematical model of cancer growth controled by metronomic chemotherapies. ESAIM: PROCEEDINGS. 2013;41:77–94.
-
- Ardizzoni A, Boni L, Tiseo M, Fossella FV, Schiller JH, Paesmans M, Radosavljevic D, Paccagnella A, Zatloukal P, Mazzanti P, Bisset D, Rosell R Group CM-a. Cisplatin-versus carboplatin-based chemotherapy in first-line treatment of advanced non-small-cell lung cancer: an individual patient data meta-analysis. J Natl Cancer Inst. 2007;99:847–57. doi: 10.1093/jnci/djk196. - DOI - PubMed
Publication types
MeSH terms
Substances
Grants and funding
LinkOut - more resources
Full Text Sources
Other Literature Sources
Medical
