. 2018 Apr 3;37(1):74.
doi: 10.1186/s13046-018-0742-2.

Mature and progenitor endothelial cells perform angiogenesis also under protease inhibition: the amoeboid angiogenesis

Affiliations

Mature and progenitor endothelial cells perform angiogenesis also under protease inhibition: the amoeboid angiogenesis

Anastasia Chillà et al. J Exp Clin Cancer Res. .

Abstract

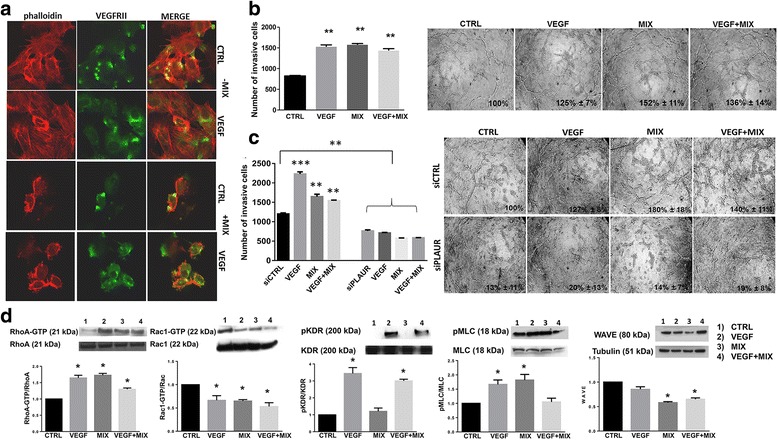
Background: Controlling vascular growth is a challenging aim for the inhibition of tumor growth and metastasis. The amoeboid and mesenchymal types of invasiveness are two modes of migration interchangeable in cancer cells: the Rac-dependent mesenchymal migration requires the activity of proteases; the Rho-ROCK-dependent amoeboid motility is protease-independent and has never been described in endothelial cells.

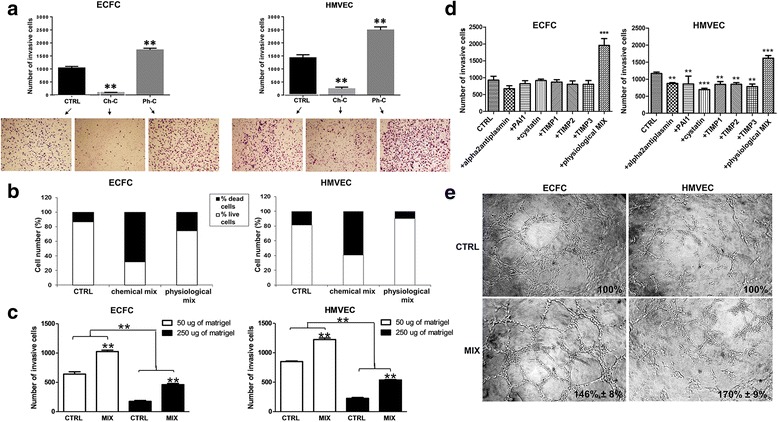
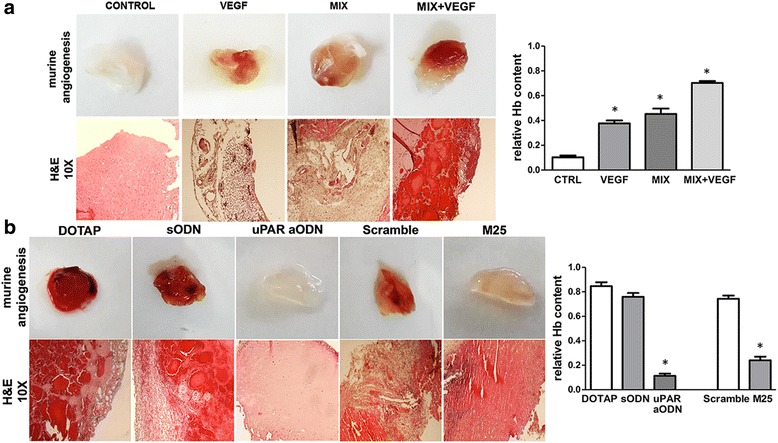
Methods: A cocktail of physiologic inhibitors (Ph-C) of serine-proteases, metallo-proteases and cysteine-proteases, mimicking the physiological environment that cells encounter during their migration within the angiogenesis sites was used to induce amoeboid style migration of Endothelial colony forming cells (ECFCs) and mature endothelial cells (ECs). To evaluate the mesenchymal-ameboid transition RhoA and Rac1 activation assays were performed along with immunofluorescence analysis of proteins involved in cytoskeleton organization. Cell invasion was studied in Boyden chambers and Matrigel plug assay for the in vivo angiogenesis.

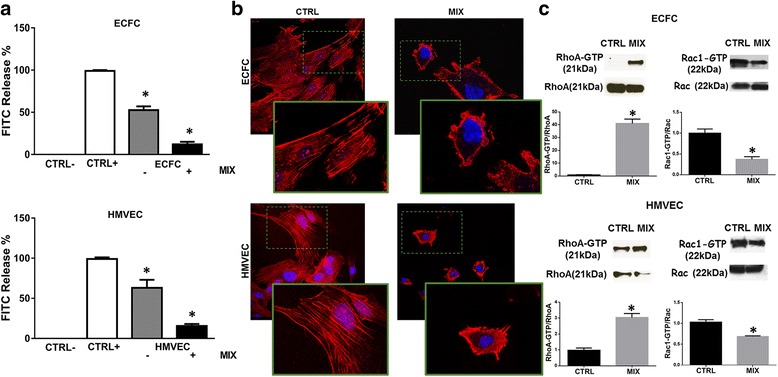
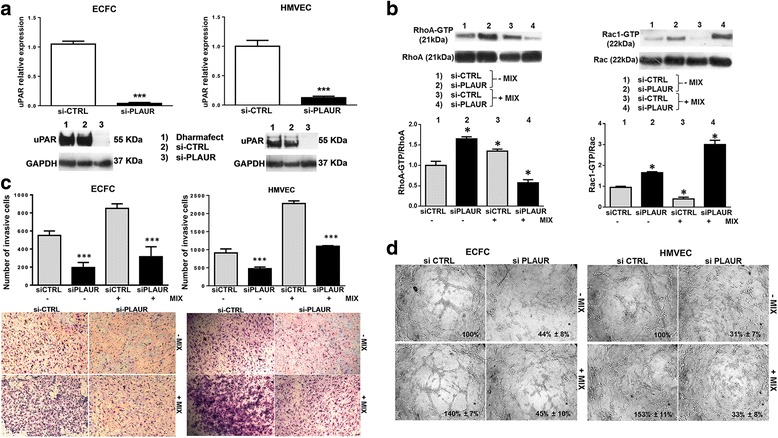
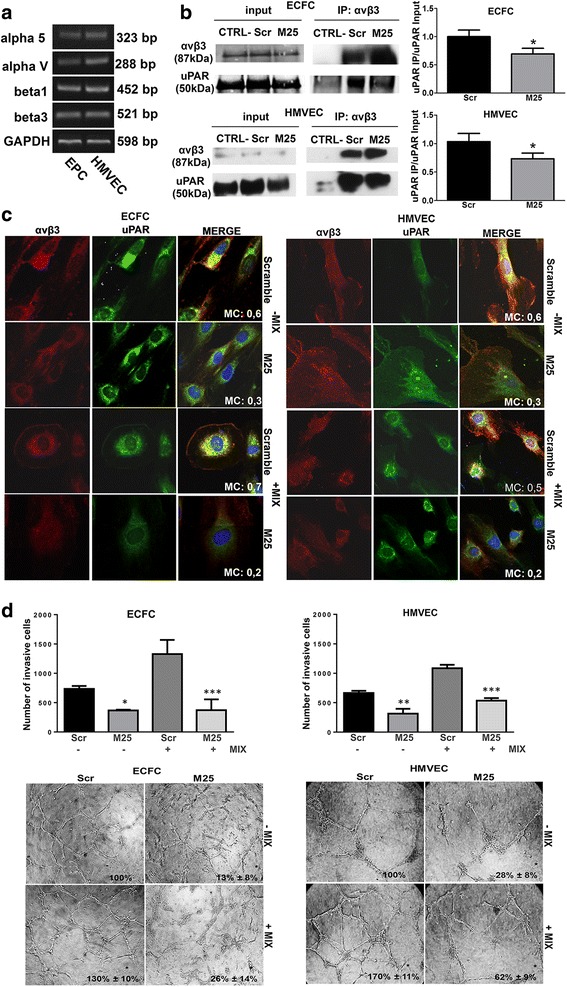
Results: In the present study we showed in both ECFCs and ECs, a decrease of activated Rac1 and an increase of activated RhoA upon shifting of cells to the amoeboid conditions. In presence of Ph-C inhibitors both cell lines acquired a round morphology and Matrigel invasion was greatly enhanced with respect to that observed in the absence of protease inhibition. We also observed that the urokinase-plasminogen-activator (uPAR) receptor silencing and uPAR-integrin uncoupling with the M25 peptide abolished both mesenchymal and amoeboid angiogenesis of ECFCs and ECs in vitro and in vivo, indicating a role of the uPAR-integrin-actin axis in the regulation of amoeboid angiogenesis. Furthermore, under amoeboid conditions endothelial cells seem to be indifferent to VEGF stimulation, which induces an amoeboid signaling pattern also in mesenchymal conditions.

Conclusion: Here we first provide a data set disclosing that endothelial cells can move and differentiate into vascular structures in vitro and in vivo also in the absence of proteases activity, performing a new type of neovascularization: the "amoeboid angiogenesis". uPAR is indispensable for ECs and ECFCs to perform an efficient amoeboid angiogenesis. Therefore, uPAR silencing or the block of its integrin-interaction, together with standard treatment against VEGF, could be a possible solution for angiogenesis inhibition.


Conflict of interest statement

Ethics approval and consent to participate

Endothelial Colony Forming Cells (ECFCs) were isolated from > 50 ml human umbilical cord blood (UCB) of healthy newborns after maternal informed consent and in compliance with Italian legislation. All procedures involving animals were performed in accordance with the ethical standards and according to the Declaration of Helsinki and to national guidelines, approved by the ethical committee of Animal Welfare Office of Italian Health Ministry and conformed to the legal mandates and Italian guidelines for the care and maintenance of laboratory animals.

Competing interests

The authors declare that they have no competing interests.

Publisher’s Note

Springer Nature remains neutral with regard to jurisdictional claims in published maps and institutional affiliations.

Figures

Fig. 1
Fig. 1
Induction of the amoeboid phenotype: Matrigel invasion and capillary morphogenesis. a Boyden chamber invasion assay through a thick Matrigel coating, in the presence of a chemical (Ch-C) or physiologic (Ph-C or MIX) protease inhibitor cocktail added to the Matrigel solution before polymerization. Histograms refer to quantification of Matrigel invasion assay obtained by counting the total number of migrated cells/filter. b ECFC and HMVEC cell viability upon protease inhibitor treatment after 6 and 24 (similar results not shown) hours evaluated by Trypan blue dye exclusion assay. The columns of histograms show in white the percentage of live cells and in black the percentage of dead cells. c ECFC and HMVEC invasion capacity in a Matrigel layer five times more concentrated (250 μg) than the usually used (50 μg). The ratio between the percentages of migrated cells in mesenchymal or amoeboid conditions after the increase of the Matrigel thickness doesn’t change. d Matrigel invasion assay in the presence of single inhibitors of the physiological MIX. Histograms refer to quantification of Matrigel invasion assay obtained by counting the total number of migrated cells/filter. e In vitro angiogenesis measured by capillary morphogenesis at 6 h in the presence and in the absence of the protease inhibitor MIX. Numbers on the lower right side of each picture indicate the percent field occupancy of capillary plexus as described in the Materials and Methods section. Quantification was performed at 6 h after seeding and was obtained by scanning of six to nine photographic fields for each condition. Results are the mean of 5 different experiments performed in duplicate, on two different clones derived from two different donors, on each cell line and are shown as mean value ± SD. *: p < 0.05; **: p < 0,001; ***p < 0,0001 significantly different from control
Fig. 2
Fig. 2
Induction of the amoeboid phenotype: cell morphology and Rac1/RhoA activation. a Histograms show the collagenolytic activity of ECFC and HMVEC cells under mesenchymal (-MIX) and amoeboid conditions (+MIX), expressed as % collagen degradation with respect to the positive control obtained by addition of exogenous collagenase. Ctrl-: collagenolytic activity in the absence of cells and exogenous collagen; Ctrl+: collagenolytic activity in the absence of cells but in the presence of exogenous collagenase; ECFC and HMVEC: collagenolytic activity in the presence of ECFCs or HMVECs. b Morphological features of the mesenchymal (elongated) to amoeboid (roundish) transition (MAT) of ECFCs and HMVECs. Each picture shows the general pattern and related magnification of a small field for each cell line. Red: phalloidin staining of the actin cytoskeleton. Blue: nuclear staining with DAPI. Magnification 40 X for reference pictures and 100 X for enlarged insets. Results shown are representative of two different preparations of each cell line under mesenchymal and amoeboid conditions. Sub-membranous cortical actin localization are evident chiefly in HMVECs and ECFCs. c Western blotting of total and GTP-loaded forms of small Rho-GTPasesRhoA and Rac1 under mesenchymal and amoeboid conditions for each cell line. RhoA-GTP and Rac1- GTP, GTP-loaded forms of small Rho GTP-ases; RhoA and Rac, total un-loaded forms of small Rho GTP-ases, used as a reference loading control. Numbers on the left refer to molecular weights expressed in kDa. Histograms report band densitometry. Results are the mean of 5 different experiments performed in duplicate, on two different clones derived from two different donors, on each cell line and are shown as mean value ± SD. *: p < 0.05 significantly different from control
Fig. 3
Fig. 3
Effects of uPAR silencing on Rho-GTPases activation, invasion and capillary morphogenesis in mesenchymal, amoeboid conditions. a The upper panel shows quantitative Real-Time PCR of uPAR relative expression in both cell lines after siPLAUR treatment. Not-targeting siRNA pool constructs were used as negative control (siCONTROL). The lower panel shows western blotting analysis of uPAR for each cell line after siPLAUR treatment. Dharmafect: treatment of cells with the transfection reagent alone. Numbers on the left of each Western blotting refer to molecular weights expressed in kDa. b Western blotting of total and GTP-loaded forms of small Rho-GTPasesRhoA and Rac1 under mesenchymal and amoeboid conditions in ECFCs untreated and treated with siCTRL/siPLAUR, respectively. Histograms report RhoA-GTP/RhoA and Rac1-GTP/Rac1 ratio obtained by band densitometry quantification. The same experiment on HMVECs gave similar results (not shown). c Matrigel invasion under mesenchymal and amoeboid conditions untreated and treated with siCTRL/siPLAUR, respectively. Histograms refer to quantification of Matrigel invasion assay obtained by counting the total number of migrated cells/filter. d In vitro angiogenesis before and after uPAR silencing by siPLAUR was measured by capillary morphogenesis at 6 h in the presence and in the absence of the protease inhibitor MIX. Numbers on the lower right side of each picture indicate the percent field occupancy of capillary plexus as described in the Materials and Methods section. Quantification was performed at 6 h after seeding and was obtained by scanning of six to nine photographic fields for each condition. Results are the mean of 5 different experiments performed in duplicate, on two different clones derived from two different donors, on each cell line and are shown as mean value ± SD. *: p < 0.05; **: p < 0,001; ***p < 0,0001 significantly different from control
Fig. 4
Fig. 4
Integrin pattern and uPAR integrin interaction in amoeboid angiogenesis. a Semiquantitative PCR of the shown integrin α and β chains in ECFCs and HMVECs. GAPDH was used as a reference control. Product sizes, expressed in bp, are reported on the right. b Immunoprecipitation of αvβ3-integrin. Input: Western blotting of aliquots (30 μg of proteins) of cell lysates before immunoprecipitation, used as a reference loading control. IP αvβ3: immunoprecipitate (500 μg of proteins) obtained with anti-αvβ3-integrin antibody; alphav/beta3 lane: immunoblotting with anti-αvβ3 antibody; uPAR lane: immunoblotting with anti-uPAR antibody; CTRL-: a lysate that was treated with non-specific IgG (and Protein A/G) instead of the antibody and used as negative control. Molecular weights, expressed in kDa, are reported on the right. Histograms report band densitometry. Results are the mean of 3 different experiments performed in duplicate on each cell line and are shown as mean value ± SD. *: p < 0.05 significantly different from control c Confocal microscopy for αvβ3 integrin (red fluorescence) and uPAR (green fluorescence) co-localization in under mesenchymal (-MIX) and amoeboid (+MIX) conditions, in the absence and in the presence of M25 peptide and scramble M25 peptide (Scramble). Nuclear staining: DAPI (blue). The co-localization score is reported within each picture (MC: Manders’coefficient). Magnification: 40 X. The shown pictures are representative of 50 different pictures for each experimental condition and were studied by Image J analysis. d The upper panel shows Matrigel invasion under mesenchymal and amoeboid conditions untreated and treated with scramble M25 (Scr) and M25 peptide (M25), respectively. Histograms refer to quantification of Matrigel invasion assay obtained by counting the total number of migrated cells/filter. The lower panel shows in vitro angiogenesis at the same conditions described for Matrigel invasion. Numbers on the lower right side of each picture indicate the percent field occupancy of capillary plexus as described in the Materials and Methods section. Quantification was performed at 6 h after seeding and was obtained by scanning of six to nine photographic fields for each condition. Results are the mean of 5 different experiments performed in duplicate, on two different clones derived from two different donors, on each cell line and are shown as mean value ± SD. *: p < 0.05; **: p < 0,001; ***p < 0,0001 significantly different from control
Fig. 5
Fig. 5
VEGF role in amoeboid angiogenesis. a Confocal microscopy for F-actin by phalloidin staining (red fluorescence) and VEGFRII (green fluorescence) under mesenchymal (-MIX) and amoeboid (+MIX) conditions, in the absence and in the presence of VEGF. Magnification: 40 X. Phalloidin was used to make more evident the cell membrane profile under amoeboid conditions. b Histogram on the left refers to quantification of Matrigel invasion assay obtained by counting the total number of migrated cells/filter. The assay was performed in the presence and in the absence of the MIX added to the Matrigel solution before polymerization and after addition of VEGF in the cell suspension. On the right capillary morphogenesis performed at the same conditions described for Matrigel invasion assay. Numbers on the lower right side of each picture indicate the percent field occupancy of capillary plexus as described in the Materials and Methods section. Quantification was performed at 6 h after seeding and was obtained by scanning of six to nine photographic fields for each condition. c Hystogram on the left shows results from boyden chamber invasion assay through a thick Matrigel coating in mesenchymal and amoeboid conditions, before and after uPAR silencing and with and without VEGF stimulation. siCTRL: negative control. siPLAUR: specific siRNA smart pools directed to uPAR gene. On the right capillary morphogenesis performed at the same conditions described for Matrigel invasion assay. d Western blotting results show the effects of VEGF, in mesenchymal and amoeboid conditions, on the intracellular signaling molecules RhoA and Rac1, the phosphorylation of KDR and MLC2 and WAVE2. Numbers on the left refer to molecular weights expressed in kDa. Histograms report band densitometry. Results are the mean of 5 different experiments performed in duplicate, on two different clones derived from two different donors, on each cell line and are shown as mean value ± SD. *: p < 0.05; **: p < 0,001; ***p < 0,0001 significantly different from control. Figure 5 shows results obtained with ECFCs. HMVECs gave similar results (not shown)
Fig. 6
Fig. 6
In vivo amoeboid angiogenesis. Effects of uPAR silencing and uPAR-integrin uncoupling in Matrigel Plug Assay. Angiogenesis in a Matrigel plug assay in SCID mice by the subcutaneosly addition of Matrigel containing heparin (50 U/ml) with and without VEGF in both mesenchymal and amoeboid conditions. a In the first lane, a representative photograph of individual Matrigel plugs recovered at autopsy for each condition shown. Angiogenesis was evaluated by hemoglobin (Hb) contents shown in the histograms on the right. Consecutive 5 μm histological sections from Matrigel plugs were recovered 5 days after implantation. The second lane shows hematoxylin/eosin staining. b Angiogenesis in a Matrigel plug assay in SCID mice by the subcutaneosly addition of Matrigel containing heparin (50 U/ml) and protease inhibitor mix. Treatments consisted in plug administration of liposome-encapsulated vehicle alone (DOTAP), DOTAP + scramble ODN (sODN), DOTAP + uPAR-aODN (uPARaODN), scramble M25 peptide (Scramble) and M25 peptide (M25). In the first lane, a representative photograph of individual Matrigel plugs recovered at autopsy for each condition shown. Angiogenesis was evaluated by hemoglobin (Hb) contents shown in the histograms on the right. Consecutive 5 μm histological sections from Matrigel plugs were recovered 5 days after implantation. The second and the third lane show hematoxylin/eosin. Images were captured at Å~ 10 magnification. Pictures shown in the figures (a) and (b) are representative of 2 different experiments performed in duplicate on two mice for each experimental condition, each mouse injected in both flanks

Similar articles

Cited by

References

    1. Friedl P. Prespecification and plasticity: shifting mechanisms of cell migration. Curr Opin Cell Biol. 2004;16:14–23. doi: 10.1016/j.ceb.2003.11.001. - DOI - PubMed
    1. Adams RH, Alitalo K. Molecular regulation of angiogenesis and lymphangiogenesis. Nat Rev Mol Cell Biol. 2007;8:464–478. doi: 10.1038/nrm2183. - DOI - PubMed
    1. Laurenzana A, Fibbi G, Chillà A, et al. Lipid rafts: integrated platforms for vascular organization offering therapeutic opportunities. Cell Mol Life Sci. 2015;72:1537–1557. doi: 10.1007/s00018-014-1814-x. - DOI - PMC - PubMed
    1. Nobes CD, Hall A. Rho, rac, and cdc42 GTPases regulate the assembly of multimolecular focal complexes associated with actin stress fibers, lamellipodia, and filopodia. Cell. 1995;81:53–62. doi: 10.1016/0092-8674(95)90370-4. - DOI - PubMed
    1. Wolfenson H, Henis YI, Geiger B, et al. The heel and toe of the cell's foot: a multifaceted approach for understanding the structure and dynamics of focal adhesions. Cell Motil Cytoskeleton. 2009;66:1017–1029. doi: 10.1002/cm.20410. - DOI - PMC - PubMed

MeSH terms