

HIV Clustering in Mississippi: Spatial Epidemiological Study to Inform Implementation Science in the Deep South
- PMID: 29615383
- PMCID: PMC5904450
- DOI: 10.2196/publichealth.8773
HIV Clustering in Mississippi: Spatial Epidemiological Study to Inform Implementation Science in the Deep South
Abstract
Background: In recent years, more than half of new HIV infections in the United States occur among African Americans in the Southeastern United States. Spatial epidemiological analyses can inform public health responses in the Deep South by identifying HIV hotspots and community-level factors associated with clustering.
Objective: The goal of this study was to identify and characterize HIV clusters in Mississippi through analysis of state-level HIV surveillance data.
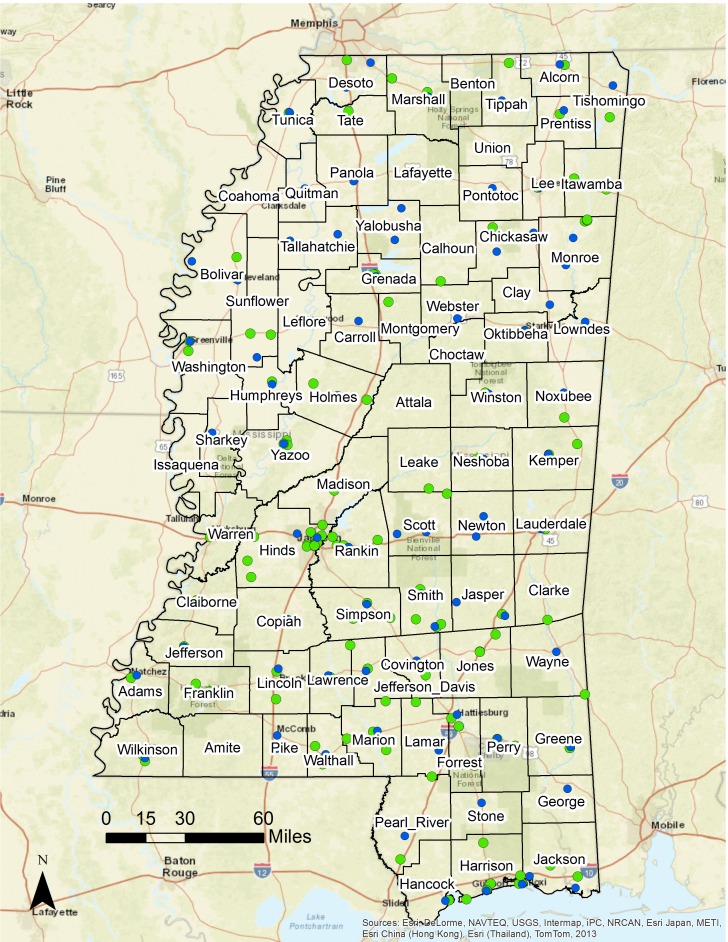
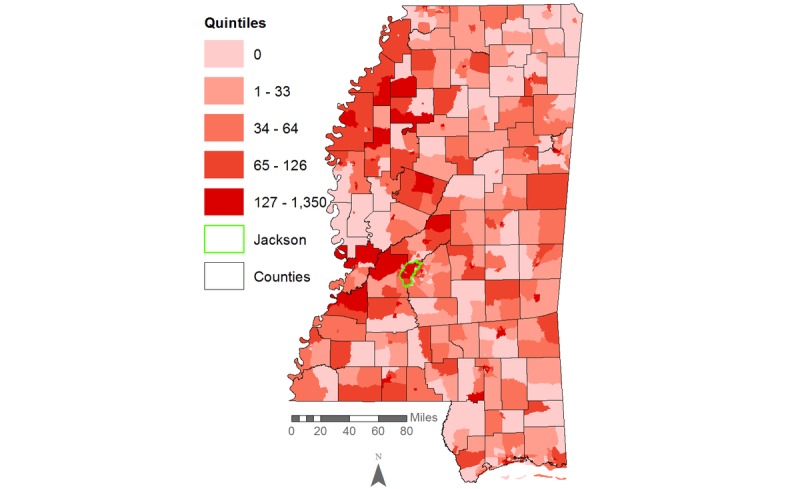
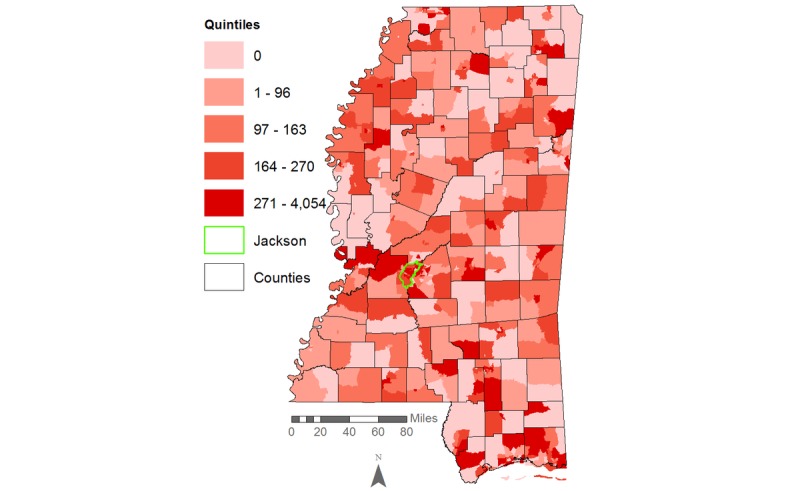
Methods: We used a combination of spatial epidemiology and statistical modeling to identify and characterize HIV hotspots in Mississippi census tracts (n=658) from 2008 to 2014. We conducted spatial analyses of all HIV infections, infections among men who have sex with men (MSM), and infections among African Americans. Multivariable logistic regression analyses identified community-level sociodemographic factors associated with HIV hotspots considering all cases.
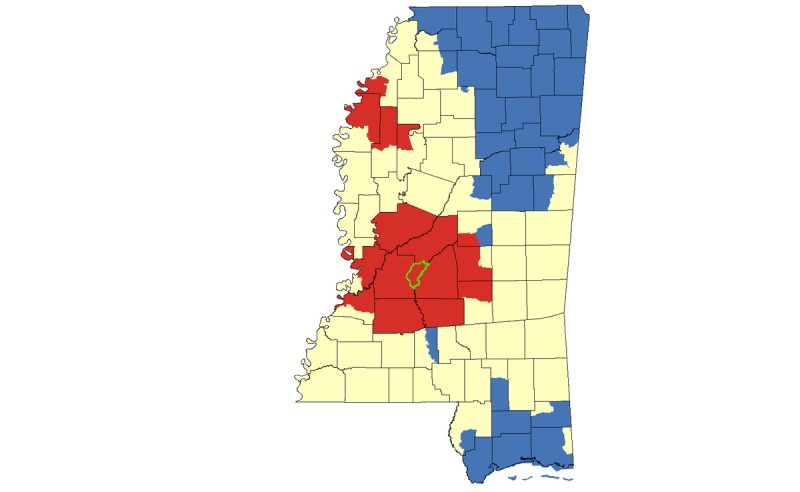
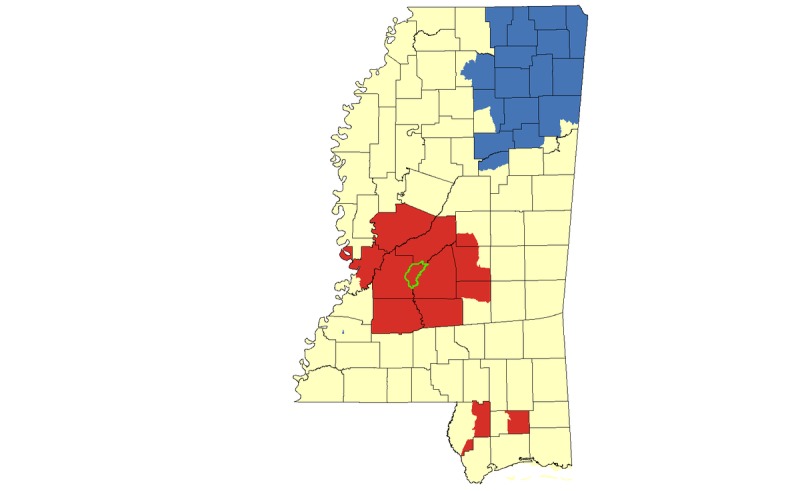
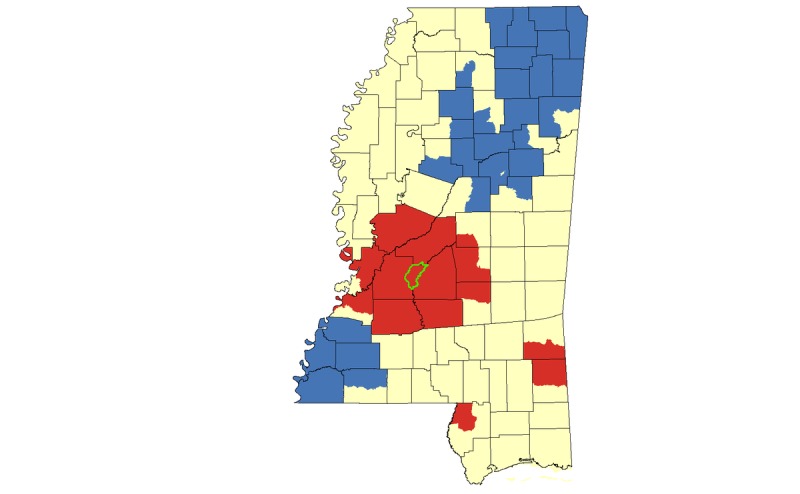
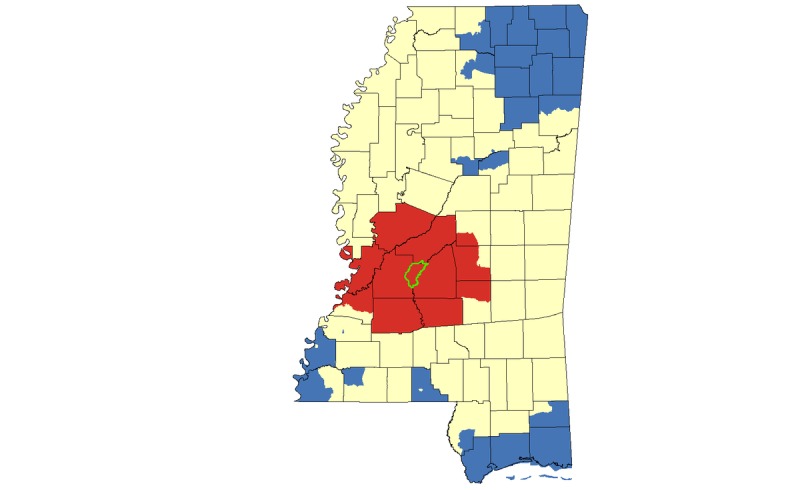
Results: There were HIV hotspots for the entire population, MSM, and African American MSM identified in the Mississippi Delta region, Southern Mississippi, and in greater Jackson, including surrounding rural counties (P<.05). In multivariable models for all HIV cases, HIV hotspots were significantly more likely to include urban census tracts (adjusted odds ratio [AOR] 2.01, 95% CI 1.20-3.37) and census tracts that had a higher proportion of African Americans (AOR 3.85, 95% CI 2.23-6.65). The HIV hotspots were less likely to include census tracts with residents who had less than a high school education (AOR 0.95, 95% CI 0.92-0.98), census tracts with residents belonging to two or more racial/ethnic groups (AOR 0.46, 95% CI 0.30-0.70), and census tracts that had a higher percentage of the population living below the poverty level (AOR 0.51, 95% CI 0.28-0.92).
Conclusions: We used spatial epidemiology and statistical modeling to identify and characterize HIV hotspots for the general population, MSM, and African Americans. HIV clusters concentrated in Jackson and the Mississippi Delta. African American race and urban location were positively associated with clusters, whereas having less than a high school education and having a higher percentage of the population living below the poverty level were negatively associated with clusters. Spatial epidemiological analyses can inform implementation science and public health response strategies, including improved HIV testing, targeted prevention and risk reduction education, and tailored preexposure prophylaxis to address HIV disparities in the South.
Keywords: HIV; HIV screening; HIV treatment; hotspots; racial disparities; social determinants of health.
©Thomas J Stopka, Lauren Brinkley-Rubinstein, Kendra Johnson, Philip A Chan, Marga Hutcheson, Richard Crosby, Deirdre Burke, Leandro Mena, Amy Nunn. Originally published in JMIR Public Health and Surveillance (http://publichealth.jmir.org), 03.04.2018.
Conflict of interest statement
Conflicts of Interest: None declared.
Figures
References
-
- Nunn A, Yolken A, Cutler B, Trooskin S, Wilson P, Little S, Mayer K. Geography should not be destiny: focusing HIV/AIDS implementation research and programs on microepidemics in US neighborhoods. Am J Public Health. 2014 May;104(5):775–780. doi: 10.2105/AJPH.2013.301864. http://europepmc.org/abstract/MED/24716570 - DOI - PMC - PubMed
-
- Centers for Disease Control and Prevention. 2015. [2018-03-09]. Diagnoses of HIV infection in the United States and dependent areas https://www.cdc.gov/hiv/library/reports/hiv-surveillance.html . - PMC - PubMed
-
- CDC Issue Brief: HIV in the Southern United States. Atlanta, GA: Centers for Disease Control and Prevention; 2016. May, [2018-03-09]. https://www.cdc.gov/hiv/pdf/policies/cdc-hiv-in-the-south-issue-brief.pdf .
-
- Brouwer KC, Rusch ML, Weeks JR, Lozada R, Vera A, Magis-Rodríguez C, Strathdee SA. Spatial epidemiology of HIV among injection drug users in Tijuana, Mexico. Ann Assoc Am Geogr. 2012;102(5):1190–1199. doi: 10.1080/00045608.2012.674896. http://europepmc.org/abstract/MED/23606753 - DOI - PMC - PubMed
-
- Stopka TJ, Lutnick A, Wenger LD, Deriemer K, Geraghty EM, Kral AH. Demographic, risk, and spatial factors associated with over-the-counter syringe purchase among injection drug users. Am J Epidemiol. 2012 Jul 01;176(1):14–23. doi: 10.1093/aje/kwr492. http://europepmc.org/abstract/MED/22562660 kwr492 - DOI - PMC - PubMed
Grants and funding
LinkOut - more resources
Full Text Sources
Other Literature Sources
