. 2018 Apr 3;9(2):e00451-18.
doi: 10.1128/mBio.00451-18.

Conservation and Divergence in the Candida Species Biofilm Matrix Mannan-Glucan Complex Structure, Function, and Genetic Control

Affiliations

Conservation and Divergence in the Candida Species Biofilm Matrix Mannan-Glucan Complex Structure, Function, and Genetic Control

Eddie Dominguez et al. mBio. .

Abstract

Candida biofilms resist the effects of available antifungal therapies. Prior studies with Candida albicans biofilms show that an extracellular matrix mannan-glucan complex (MGCx) contributes to antifungal sequestration, leading to drug resistance. Here we implement biochemical, pharmacological, and genetic approaches to explore a similar mechanism of resistance for the three most common clinically encountered non-albicansCandida species (NAC). Our findings reveal that each Candida species biofilm synthesizes a mannan-glucan complex and that the antifungal-protective function of this complex is conserved. Structural similarities extended primarily to the polysaccharide backbone (α-1,6-mannan and β-1,6-glucan). Surprisingly, biochemical analysis uncovered stark differences in the branching side chains of the MGCx among the species. Consistent with the structural analysis, similarities in the genetic control of MGCx production for each Candida species also appeared limited to the synthesis of the polysaccharide backbone. Each species appears to employ a unique subset of modification enzymes for MGCx synthesis, likely accounting for the observed side chain diversity. Our results argue for the conservation of matrix function among Candida spp. While biogenesis is preserved at the level of the mannan-glucan complex backbone, divergence emerges for construction of branching side chains. Thus, the MGCx backbone represents an ideal drug target for effective pan-Candida species biofilm therapy.IMPORTANCECandida species, the most common fungal pathogens, frequently grow as a biofilm. These adherent communities tolerate extremely high concentrations of antifungal agents, due in large part, to a protective extracellular matrix. The present studies define the structural, functional, and genetic similarities and differences in the biofilm matrix from the four most common Candida species. Each species synthesizes an extracellular mannan-glucan complex (MGCx) which contributes to sequestration of antifungal drug, shielding the fungus from this external assault. Synthesis of a common polysaccharide backbone appears conserved. However, subtle structural differences in the branching side chains likely rely upon unique modification enzymes, which are species specific. Our findings identify MGCx backbone synthesis as a potential pan-Candida biofilm therapeutic target.

Keywords: Candida; antifungal resistance; biofilm; extracellular matrix; non-albicans.


Figures

FIG 1
FIG 1
NAC form biofilms with variable characteristics. (A) Biofilm adhesion of reference strains for C. albicans (CA), C. tropicalis (CT), C. parapsilosis (CP), and C. glabrata (CG) was assessed using an XTT assay in a 96-well polystyrene plate after 1 h for adherence. The asterisks indicate statistically significant lower concentrations (P < 0.001) for C. parapsilosis and C. glabrata based upon ANOVA using the Holm-Sikak method for pairwise comparison. OD 492, optical density at 492 nm. (B) Mature biofilm formation for each of the four species was quantified in a 96-well format using an XTT endpoint after 24 h of incubation. The asterisk indicates a statistically significant lower concentration (P < 0.001) for C. glabrata based upon ANOVA using the Holm-Sikak method for pairwise comparison. (C) Mature biofilm architecture of wild-type biofilms from in vitro coverslips and the in vivo rat catheter model was assessed visually using SEM imaging after 24 h of incubation. The white arrows indicate extracellular matrix material. Bars, 20 µm.
FIG 2
FIG 2
NAC form biofilm matrix of variable quantity and quality. (A) Total biofilm mass was assessed by measurements (dry weight) of in vitro biofilms grown in polystyrene roller bottles (three replicates of 20 bottles per species). The four species studied were C. albicans (CA), C. tropicalis (CT), C. parapsilosis (CP), and C. glabrata (CG). The single asterisks indicate statistically significant lower values (P < 0.001) for C. tropicalis and C. glabrata based upon ANOVA using the Holm-Sikak method for pairwise comparison. (B) Biofilm matrix biomass was quantified by the dry weight following matrix separation from biofilm cells. Biofilms were grown in polystyrene roller bottles (three replicates of five bottles per species). Two asterisks indicate statistically lower values for C. tropicalis (P = 0.003) and C. glabrata (P = 0.005) between strains based upon ANOVA using the Holm-Sikak method for pairwise comparison. (C) Biofilm matrix total carbohydrate concentration was assessed using the phenol-sulfuric acid assay. The results were normalized by matrix biomass. The single asterisks indicate statistically lower concentrations for C. parapsilosis (P = 0.009) and C. glabrata (P = 0.002) based upon ANOVA using the Holm-Sikak method for pairwise comparison. (D) Relative percent monosugar composition (Rha, rhamnose; Rib, ribose; Man, mannose; Glu, glucose) in the biofilm matrix of C. albicans, C. tropicalis, C parapsilosis, and C. glabrata. The single asterisks indicate statistically significant differences (P < 0.001) between strains based upon ANOVA. (E) Biofilm matrix total protein concentration was assessed using the BCA protein assay kit. The results were normalized by matrix biomass. The single asterisks indicate statistically lower concentrations for C. tropicalis, C. parapsilosis, and C. glabrata (P < 0.001) than for C. albicans based upon ANOVA using the Holm-Sikak method for pairwise comparison. (F) Biofilm matrix total eDNA. The results were normalized by matrix biomass. The single asterisks indicate statistically lower concentrations for C. tropicalis, C. parapsilosis, and C. glabrata (P < 0.001) than for C. albicans based upon ANOVA using the Holm-Sikak method for pairwise comparison. (G) Biofilm matrix total lipid concentration was assessed by gas chromatography. The results were normalized by matrix biomass.
FIG 3
FIG 3
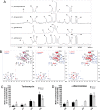
Comparative chromatographic fractionation and NMR analysis of carbohydrates from the Candida species biofilm extracellular matrix. (A) Comparison of the 500-MHz 1H NMR spectra of purified neutral matrix polysaccharides from C. albicans, C. tropicalis, C. parapsilosis, and C. glabrata biofilm matrix. See Table 2. (B) Comparison of C. albicans NMR spectra spin systems to each of the NAC species (C. tropicalis, C. parapsilosis, and C. glabrata, respectively) as reflected by heteronuclear single quantum coherence (HSQC) and nuclear Overhauser effect spectroscopy (NOESY) data. (C and D) Carbohydrates in the matrix of wild-type biofilms treated with tunicamycin (C) and α-mannosidase (D) were quantified by gas chromatography. Data are presented as percentages of the reference strain (Ref), with means ± standard errors (SEs) (error bars) shown. All values were significantly lower than the reference value according to ANOVA as indicated by the single asterisks.
FIG 4
FIG 4
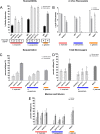
NAC biofilm drug resistance phenotype and mechanism. (A) Biofilm antifungal susceptibility (fluconazole [125 or 1,000 µg/ml] for 48 h) of wild-type C. albicans, C. tropicalis, C. parapsilosis, and C. glabrata was assessed using an XTT assay in a 96-well polystyrene plate assay. The asterisk indicates a statistically significant difference (P < 0.001) between strains based upon ANOVA using the Holm-Sikak method for pairwise comparison. (B) Biofilm antifungal susceptibility (fluconazole [250 µg/ml] after 24-h exposure) of wild-type C. albicans, C. tropicalis, C. parapsilosis, and C. glabrata was assessed using viable counts from the rat vascular catheter biofilm model. (C) Fluconazole sequestration and binding to the Candida species biofilm extracellular matrix. Sequestration of 3H-labeled fluconazole was assessed using in vitro intact biofilms as well as the extracellular matrix and intracellular components. (D) Fluconazole binding to the NAC biofilm extracellular matrices. Fluconazole interactions with the tested matrices studied by one-dimensional 1H NMR at 600 MHz were determined as decreases in the intensity of chemical shift peaks characteristic of protons present either in the heterocyclic azole rings or the aromatic ring of the drug. Spectra were recorded at the constant fluconazole concentration of 0.653 mM, and matrix concentrations ranged from 0 up to 8 mg/ml. (E) Biofilms were treated with pharmacological inhibitors of mannan or glucan or a mannan hydrolysis enzyme both with and without 1,000 μg/ml fluconazole for all species except C. parapsilosis for which we used 250 μg/ml. Efficacy was assessed in a 96-well plate format for quantification with the XTT assay. The asterisks indicate statistically significant differences (P < 0.001) between the combination and either treatment alone based upon ANOVA using the Holm-Sikak method for pairwise comparison. FLUC, fluconazole; TM, tunicamycin; BFA, brefeldin A; α-MS, α-mannosidase.
FIG 5
FIG 5
Genetic control of NAC biofilm extracellular matrix production. Mature biofilm architecture from in vitro coverslips was assessed visually using SEM imaging after 24 h of incubation. The white arrows indicate extracellular matrix material. Bars, 20 µm.
FIG 6
FIG 6
Genetic control of NAC biofilm drug resistance and extracellular matrix production. (A) The percentage of reduction in biofilm formation following 48-h treatment with fluconazole compared with untreated biofilms, as quantified using the 96-well XTT assay. The null mutant (Δ/Δ) is shown for each gene of interest. The graph shows data from three assay replicates of a representative example of three biological replicates. Asterisks indicate statistically significant difference (P < 0.001) between the reference (wild type [WT]) and mutant based upon ANOVA using the Holm-Sidak method for pairwise comparison. The MIC of fluconazole for planktonic cells of the Δ/Δ strains is shown below the bar graph by the Plank MIC values. (B) The NAC species reference strains, kre5Δ/Δ, van1Δ/Δ, and big1Δ/Δ mutants, were tested in vivo using a rat central venous catheter model, with the effects of fluconazole or saline treatment compared with the reference strains for C. tropicalis, C. parapsilosis, and C. glabrata, respectively. Biofilms were quantified using viable-cell counts following treatment. The values are means ± standard deviations (error bars) from three replicates. The asterisks indicate that the CFU values were significantly different from the CFU for the reference strain (P < 0.001) based upon ANOVA using the Holm-Sikak method for pairwise comparison. (C) Intact biofilms grown from the wild-type and mutant strains were exposed to [3H]fluconazole, washed, and harvested. Scintillation counting was performed in triplicate to determine the fluconazole content in the intact biofilms and the isolated matrix. Standard deviations are shown. (D) Mature in vitro biofilms from the wild-type strain and null mutants were assayed for matrix carbohydrate concentration using the phenol sulfuric acid method. The value for each mutant is presented as a percentage of the value for the wild-type strain. The graph shows data from three biological replicates and three assay replicates. The asterisks indicate that glucan measurements were significantly different (P < 0.0001) from the wild-type measurement based on ANOVA. (E) Mature in vitro biofilms from the wild-type strain and null mutants were assayed for matrix glucan and mannan concentrations by gas chromatography. The value for each mutant is presented as a percentage of the value for the wild-type strain. The graph shows data from three biological replicates and three assay replicates. The asterisks indicate that glucan measurements were significantly different (P < 0.0001) from the value for the wild-type strain based upon ANOVA.

Similar articles

Cited by

References

    1. Pfaller MA, Diekema DJ. 2007. Epidemiology of invasive candidiasis: a persistent public health problem. Clin Microbiol Rev 20:133–163. doi:10.1128/CMR.00029-06. - DOI - PMC - PubMed
    1. Pfaller MA, Andes DR, Diekema DJ, Horn DL, Reboli AC, Rotstein C, Franks B, Azie NE. 2014. Epidemiology and outcomes of invasive candidiasis due to non-albicans species of Candida in 2,496 patients: data from the Prospective Antifungal Therapy (PATH) registry 2004-2008. PLoS One 9:e101510. doi:10.1371/journal.pone.0101510. - DOI - PMC - PubMed
    1. Cleveland AA, Farley MM, Harrison LH, Stein B, Hollick R, Lockhart SR, Magill SS, Derado G, Park BJ, Chiller TM. 2012. Changes in incidence and antifungal drug resistance in candidemia: results from population-based laboratory surveillance in Atlanta and Baltimore, 2008-2011. Clin Infect Dis 55:1352–1361. doi:10.1093/cid/cis697. - DOI - PMC - PubMed
    1. Lockhart SR, Iqbal N, Cleveland AA, Farley MM, Harrison LH, Bolden CB, Baughman W, Stein B, Hollick R, Park BJ, Chiller T. 2012. Species identification and antifungal susceptibility testing of Candida bloodstream isolates from population-based surveillance studies in two U.S. cities from 2008 to 2011. J Clin Microbiol 50:3435–3442. doi:10.1128/JCM.01283-12. - DOI - PMC - PubMed
    1. Andes DR, Safdar N, Baddley JW, Alexander B, Brumble L, Freifeld A, Hadley S, Herwaldt L, Kauffman C, Lyon GM, Morrison V, Patterson T, Perl T, Walker R, Hess T, Chiller T, Pappas PG, The TRANSNET Investigators . 2016. The epidemiology and outcomes of invasive Candida infections among organ transplant recipients in the United States: results of the Transplant-Associated Infection Surveillance Network (TRANSNET). Transpl Infect Dis 18:921–931. doi:10.1111/tid.12613. - DOI - PubMed

Publication types

MeSH terms