Phytophthora palmivora establishes tissue-specific intracellular infection structures in the earliest divergent land plant lineage
- PMID: 29615512
- PMCID: PMC5910834
- DOI: 10.1073/pnas.1717900115
Phytophthora palmivora establishes tissue-specific intracellular infection structures in the earliest divergent land plant lineage
Abstract
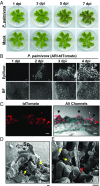
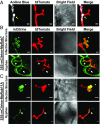
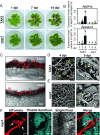
The expansion of plants onto land was a formative event that brought forth profound changes to the earth's geochemistry and biota. Filamentous eukaryotic microbes developed the ability to colonize plant tissues early during the evolution of land plants, as demonstrated by intimate, symbiosis-like associations in >400 million-year-old fossils. However, the degree to which filamentous microbes establish pathogenic interactions with early divergent land plants is unclear. Here, we demonstrate that the broad host-range oomycete pathogen Phytophthora palmivora colonizes liverworts, the earliest divergent land plant lineage. We show that P. palmivora establishes a complex tissue-specific interaction with Marchantia polymorpha, where it completes a full infection cycle within air chambers of the dorsal photosynthetic layer. Remarkably, P. palmivora invaginates M. polymorpha cells with haustoria-like structures that accumulate host cellular trafficking machinery and the membrane syntaxin MpSYP13B, but not the related MpSYP13A. Our results indicate that the intracellular accommodation of filamentous microbes is an ancient plant trait that is successfully exploited by pathogens like P. palmivora.
Keywords: Phytophthora; bryophyte; haustoria; liverworts; oomycetes.
Copyright © 2018 the Author(s). Published by PNAS.
Conflict of interest statement
The authors declare no conflict of interest.
Figures


Similar articles
-
Conserved Biochemical Defenses Underpin Host Responses to Oomycete Infection in an Early-Divergent Land Plant Lineage.Curr Biol. 2019 Jul 22;29(14):2282-2294.e5. doi: 10.1016/j.cub.2019.05.078. Epub 2019 Jul 11. Curr Biol. 2019. PMID: 31303485
-
Haustorium Formation in Medicago truncatula Roots Infected by Phytophthora palmivora Does Not Involve the Common Endosymbiotic Program Shared by Arbuscular Mycorrhizal Fungi and Rhizobia.Mol Plant Microbe Interact. 2015 Dec;28(12):1271-80. doi: 10.1094/MPMI-06-15-0130-R. Epub 2015 Oct 29. Mol Plant Microbe Interact. 2015. PMID: 26313411
-
An Evolutionarily Ancient Immune System Governs the Interactions between Pseudomonas syringae and an Early-Diverging Land Plant Lineage.Curr Biol. 2019 Jul 22;29(14):2270-2281.e4. doi: 10.1016/j.cub.2019.05.079. Epub 2019 Jul 11. Curr Biol. 2019. PMID: 31303486
-
Bud Rot Caused by Phytophthora palmivora: A Destructive Emerging Disease of Oil Palm.Phytopathology. 2016 Apr;106(4):320-9. doi: 10.1094/PHYTO-09-15-0243-RVW. Epub 2016 Mar 16. Phytopathology. 2016. PMID: 26714102 Review.
-
Communication between filamentous pathogens and plants at the biotrophic interface.Annu Rev Phytopathol. 2013;51:587-611. doi: 10.1146/annurev-phyto-081211-172916. Epub 2013 Jun 5. Annu Rev Phytopathol. 2013. PMID: 23750888 Review.
Cited by
-
Alnus glutinosa Threatened by Alder Phytophthora: A Histological Study of Roots.Pathogens. 2021 Aug 3;10(8):977. doi: 10.3390/pathogens10080977. Pathogens. 2021. PMID: 34451441 Free PMC article.
-
Comprehensive analysis of peptide-coding genes and initial characterization of an LRR-only microprotein in Marchantia polymorpha.Front Plant Sci. 2023 Jan 19;13:1051017. doi: 10.3389/fpls.2022.1051017. eCollection 2022. Front Plant Sci. 2023. PMID: 36756228 Free PMC article.
-
The renaissance and enlightenment of Marchantia as a model system.Plant Cell. 2022 Sep 27;34(10):3512-3542. doi: 10.1093/plcell/koac219. Plant Cell. 2022. PMID: 35976122 Free PMC article.
-
The Dynamic Interaction between Oil Palm and Phytophthora palmivora in Bud Rot Disease: Insights from Transcriptomic Analysis and Network Modelling.J Fungi (Basel). 2024 Feb 20;10(3):164. doi: 10.3390/jof10030164. J Fungi (Basel). 2024. PMID: 38535173 Free PMC article.
-
Cross-pathogenicity of Phytophthora palmivora associated with bud rot disease of oil palm and development of biomarkers for detection.World J Microbiol Biotechnol. 2024 Jan 2;40(2):55. doi: 10.1007/s11274-023-03860-5. World J Microbiol Biotechnol. 2024. PMID: 38165501
References
-
- Taylor TN, Remy W, Hass H, Kerp H. Fossil arbuscular mycorrhizae from the Early Devonian. Mycologia. 1995;87:560–573.
-
- Krings M, et al. Fungal endophytes in a 400-million-yr-old land plant: infection pathways, spatial distribution, and host responses. New Phytol. 2007;174:648–657. - PubMed
-
- Strullu-Derrien C, et al. Fungal associations in Horneophyton ligneri from the Rhynie Chert (c. 407 million year old) closely resemble those in extant lower land plants: novel insights into ancestral plant-fungus symbioses. New Phytol. 2014;203:964–979. - PubMed
-
- Ligrone R, et al. Glomeromycotean associations in liverworts: a molecular, cellular, and taxonomic analysis. Am J Bot. 2007;94:1756–1777. - PubMed
Publication types
MeSH terms
Grants and funding
LinkOut - more resources
Full Text Sources
Other Literature Sources

