. 2018 Apr 3;8(1):5505.
doi: 10.1038/s41598-018-23841-1.

Epigenetic alterations are associated with monocyte immune dysfunctions in HIV-1 infection

Affiliations

Epigenetic alterations are associated with monocyte immune dysfunctions in HIV-1 infection

Milena S Espíndola et al. Sci Rep. .

Abstract

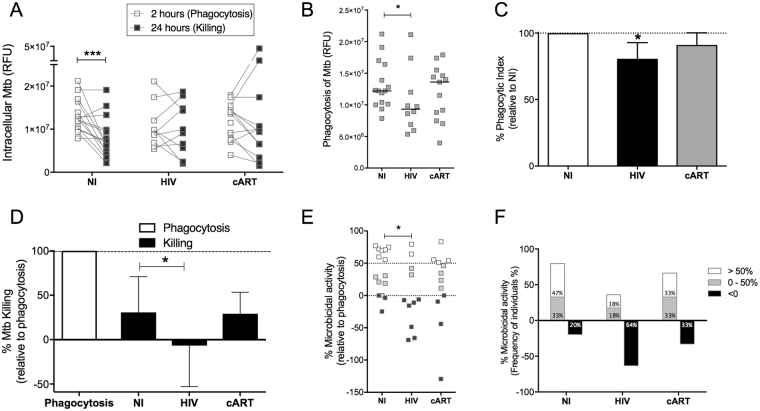
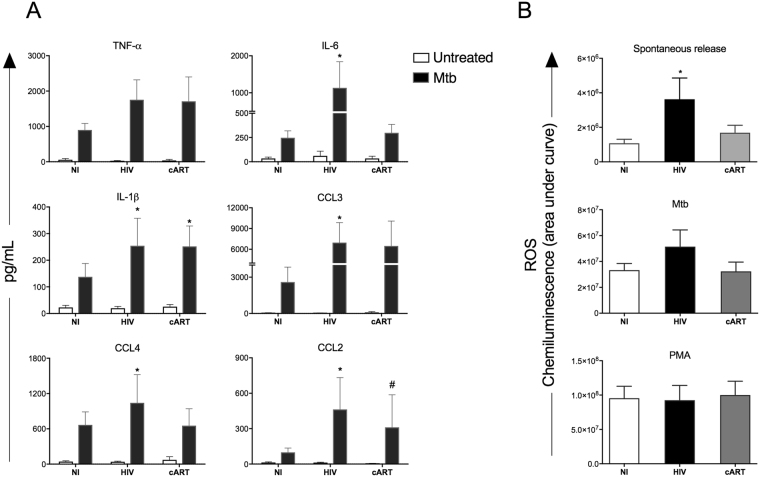
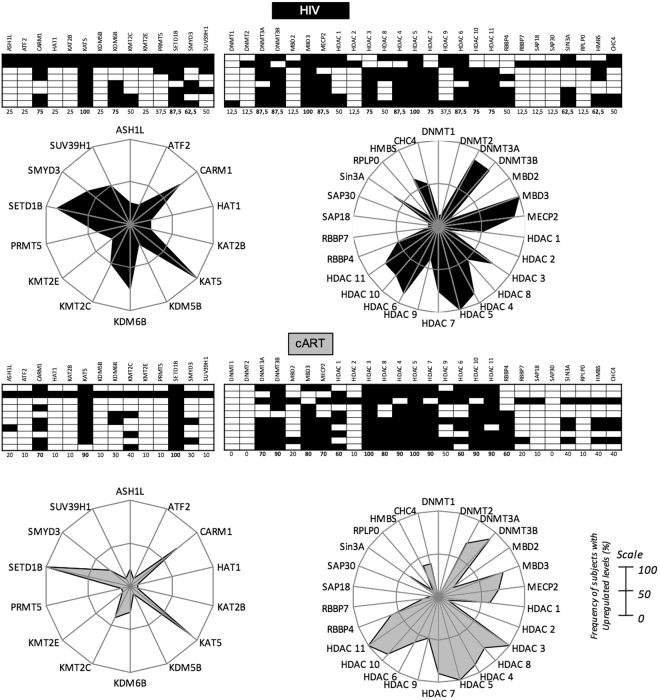
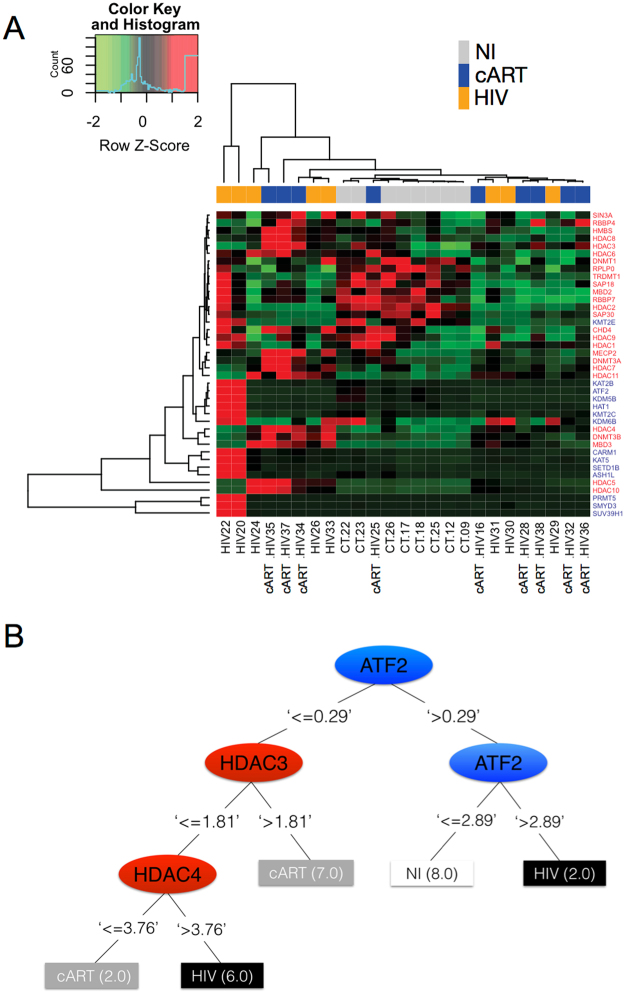
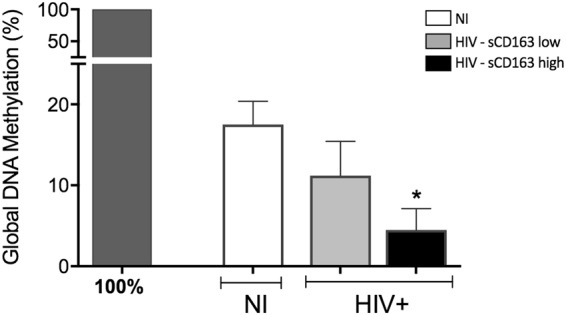
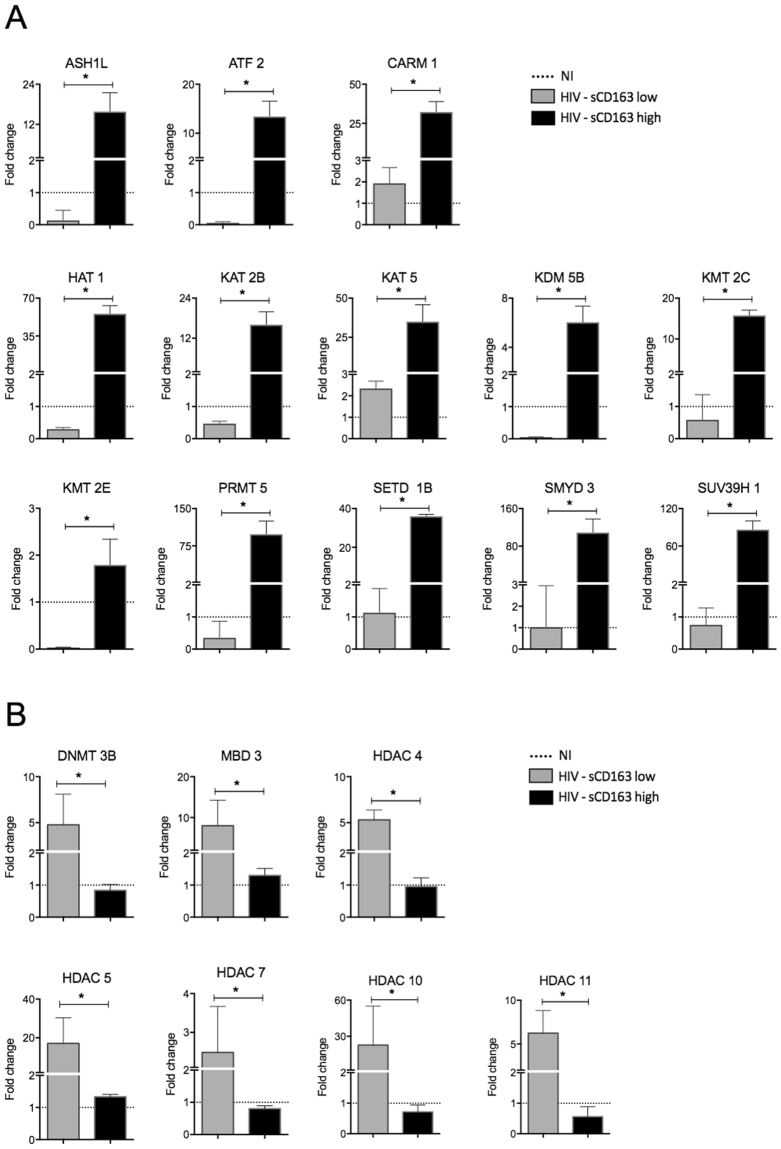
Monocytes are key cells in the immune dysregulation observed during human immunodeficiency virus (HIV) infection. The events that take place specifically in monocytes may contribute to the systemic immune dysfunction characterized by excessive immune activation in infected individuals, which directly correlates with pathogenesis and progression of the disease. Here, we investigated the immune dysfunction in monocytes from untreated and treated HIV + patients and associated these findings with epigenetic changes. Monocytes from HIV patients showed dysfunctional ability of phagocytosis and killing, and exhibited dysregulated cytokines and reactive oxygen species production after M. tuberculosis challenge in vitro. In addition, we showed that the expression of enzymes responsible for epigenetic changes was altered during HIV infection and was more prominent in patients that had high levels of soluble CD163 (sCD163), a newly identified plasmatic HIV progression biomarker. Among the enzymes, histone acetyltransferase 1 (HAT1) was the best epigenetic biomarker correlated with HIV - sCD163 high patients. In conclusion, we confirmed that HIV impairs effector functions of monocytes and these alterations are associated with epigenetic changes that once identified could be used as targets in therapies aiming the reduction of the systemic activation state found in HIV patients.


Conflict of interest statement

The authors declare no competing interests.

Figures

Figure 1
Figure 1
Functional activity of monocytes is reduced in HIV + patients and partially recovered after cART. Phagocytosis and microbicidal ability of monocytes from non-infected individuals (NI), untreated HIV + patients (HIV) or HIV + patients under cART (cART) were evaluated after Mtb infection in vitro. CD14 + monocytes were magnetically sorted and infected with Mtb (MOI 5) in vitro. Phagocytosis, evaluated after 2 hours of infection and the microbicidal activity, evaluated after 24 hours of infection, were performed separately using resazurin reduction assay by intracellular Mtb after 24 hours of incubation following the infection times. (A) Intensity of intracellular Mtb fluorescence after 2 hours (Phagocytosis) and 24 hours of infection (Killing). (B) Intracellular Mtb fluorescence intensity and (C) Phagocytic index after 2 hours of phagocytosis. (D) Percentage of microbicidal activity of monocytes compared to phagocytosis. (E) Percentage of microbicidal activity segregated according to the extent of bacillus elimination. (E) Frequency of individuals with >50%, 0–50% or <0% of Mtb killing. In graphs A and B the data is expressed in RFU (Relative fluorescence unit), and in B the line represents the median of the group. *P < 0.05; ***P < 0.001 versus NI. In Graph D results are expressed as median ± Interquartile Interval. *p < 0.05.
Figure 2
Figure 2
Monocytes from untreated HIV + patients show exacerbated production of immune mediators after Mtb stimulation. (A) Cytokines and chemokines were evaluated in monocytes from non-infected individuals (NI), untreated HIV + patients (HIV) or HIV + patients under cART (cART) 24 h after Mtb infection (MOI 5) in vitro. The cytokines and chemokines TNF-α, IL-6, IL-1β, CCL2, CCL3 and CCL4 were quantified using magnetic beads from MILLIPLEX MAP kits® Human Cytokine/Chemokine (Millipore). The result is expressed as mean ± SEM of the cytokine production of unstimulated or stimulated monocytes with Mtb. *P < 0.05 versus NI; #P < 0.05 versus HIV. (B) Reactive oxygen species were evaluated in monocytes from non-infected individuals (NI), untreated HIV + patients (HIV) or HIV + patients under cART (cART). Luminol-based assay was performed in unstimulated, heat-killed Mtb (MOI 5) or PMA (10−7M) stimulated cells. Immediately after stimulation, chemiluminescence was assessed in a luminometer for 2 hours of kinetics. The results are expressed as area under chemiluminescence curve. *p < 0.05 vs NI.
Figure 3
Figure 3
Epigenetic biosignature of monocytes from untreated or treated HIV + patients. Gene expression analysis of the enzymes responsible for activation or repression of transcription was used for categorical classification of untreated HIV + patients or those under cART according to the status of expression, upregulation and downregulation, of a given gene compared to NI individuals. Black and white diagrams represent upregulated and downregulated genes, respectively. Each lane represents a gene and each block represents the status of expression compared to NI. Numbers below each lane represent the frequency of patients with high gene expression of each enzyme evaluated. Radar charts summarize the percentage of patients with high gene expression of each studied clinical group. When the frequency was greater than 50% (on a 0–100% scale), the result was highlighted. NI (n = 10); HIV (n = 8); cART (n = 10).
Figure 4
Figure 4
Heat map of enzymes responsible for epigenetic changes defines a segregation profile upon activation or repression of transcription and between the NI and HIV groups. (A) Gene expression of enzymes responsible for activation or repression of transcription were used to calculate the Z-score for each gene produced by subjects individually from NI, HIV or cART groups, for further generation of a heat map. Row Z-score scaled from −2 to + 2 and is illustrated as green, black, and red colors. (B) The values of the gene expression were used for the decision tree dataset construction. The decision tree was generated considering the three groups separately. The numbers beside group names indicate the quantity of subjects ranked on each pathway.
Figure 5
Figure 5
Percentage of global methylation of genomic DNA differs according to the levels of sCD163 in untreated HIV + patients. Genomic DNA was extracted from CD14 + monocytes from NI individuals and untreated HIV + patients categorized as HIV sCD163-low or -high, as an indicator of progression. Determination of the overall DNA methylation was performed using the Imprinting Methylated DNA Quantification kit (Sigma Aldrich). Data is expressed as the mean of the percentage relative to 100% methylated control. *p < 0.05 versus NI.
Figure 6
Figure 6
Gene expression of enzymes responsible for epigenetic activation or repression of gene transcription segregated according to the levels of sCD163. Gene expression analysis was performed on CD14 + monocytes from NI individuals and untreated HIV + patients categorized as HIV sCD163-low or -high, as an indicator of progression. PCR Array kit “RT2 ProfilerTM PCR Array customized by Qiagen (Qiagen/SA Biosciences) was used to assess activation enzymes and TaqMan® Array, Human DNA Methylation & Transcriptional Repression (Applied Biosystems) was used to assess repression enzymes. Data is expressed as fold change relative to the geometric mean of NI. *p < 0.05.
Figure 7
Figure 7
Soluble CD163 levels of untreated HIV + patients are reflected on gene expression of enzymes responsible for epigenetic changes and on functional features of monocytes. (A) Gene expression of enzymes responsible for activation or repression of transcription were used to calculate the Z-score for each gene produced by subjects individually from HIV sCD163-low and -high, as an indicator of progression, for further generation of a heat map. Row Z-score scaled from −2 to + 2 and is illustrated as green, black, and red colors. (B) The values of the gene expression were used for the decision tree dataset construction. The decision tree was generated considering the two groups separately. The numbers beside the group names indicate the quantity of subjects ranked on each pathway. (C) Cytokines and chemokines produced by monocytes from NI individuals, untreated HIV + patients segregated according to the levels of sCD163. Cells were maintained in culture for 24 hours after Mtb infection (MOI 5) and monocyte supernatants were evaluated for the presence of TNF-α, IL-6, IL-1β and CCL2 using magnetic beads from MILLIPLEX MAP kits® Human Cytokine/Chemokine (Millipore). The result is expressed as mean ± SEM. *p < 0.05.
Figure 8
Figure 8
Schematic representation of the events of primary HIV infection and monocyte response in sCD163-low or -high HIV + patients, as an indicator of progression. Upon HIV infection, gut disruption and microbial translocation are some of the most significant events that lead to monocytes chronic activation and exhaustion, quantified by plasmatic levels of sCD163 and sCD14 (not explored in the current work), that directly correlates with systemic immune dysfunction. Here we show that dysregulation of epigenetic events is directly associated with disease progression and proinflammatory cytokines production. The consequences of increased epigenetic activation marks in monocytes may affect its primary functions, as phagocytosis, killing and immune mediators production after a secondary infection, such as M. tuberculosis. Histone acetyltransferase 1, HAT1, was the best biomarker that distinguished HIV + sCD163-low and -high patients and is a promising target in therapies aiming reduction of the systemic activation state found in HIV patients.

References

    1. Deeks SG, Tracy R, Douek DC. Systemic effects of inflammation on health during chronic HIV infection. Immunity. 2013;39:633–645. doi: 10.1016/j.immuni.2013.10.001. - DOI - PMC - PubMed
    1. Espíndola, M. S. et al. HIV infection: focus on the innate immune cells. Immunologic Research, 1–15 10.1007/s12026-016-8862-2 (2016). - PubMed
    1. Wilson, E. M. et al. Monocyte Activation Phenotypes Are Associated with Biomarkers of Inflammation and Coagulation in Chronic HIV Infection. J Infect Dis, 10.1093/infdis/jiu275 (2014). - PMC - PubMed
    1. Ford ES, et al. Traditional risk factors and D-dimer predict incident cardiovascular disease events in chronic HIV infection. AIDS. 2010;24:1509–1517. doi: 10.1097/QAD.0b013e32833ad914. - DOI - PMC - PubMed
    1. Hunt PW. Soluble CD163 and Clinical Outcomes in Treated HIV Infection: Insights Into Mechanisms. J Infect Dis. 2016;214:1132–1133. doi: 10.1093/infdis/jiw264. - DOI - PubMed

Publication types

MeSH terms