. 2018 Apr 3;8(1):5533.
doi: 10.1038/s41598-018-23923-0.

Isolation and characterisation of CD9-positive pituitary adult stem/progenitor cells in rats

Affiliations

Isolation and characterisation of CD9-positive pituitary adult stem/progenitor cells in rats

Kotaro Horiguchi et al. Sci Rep. .

Abstract

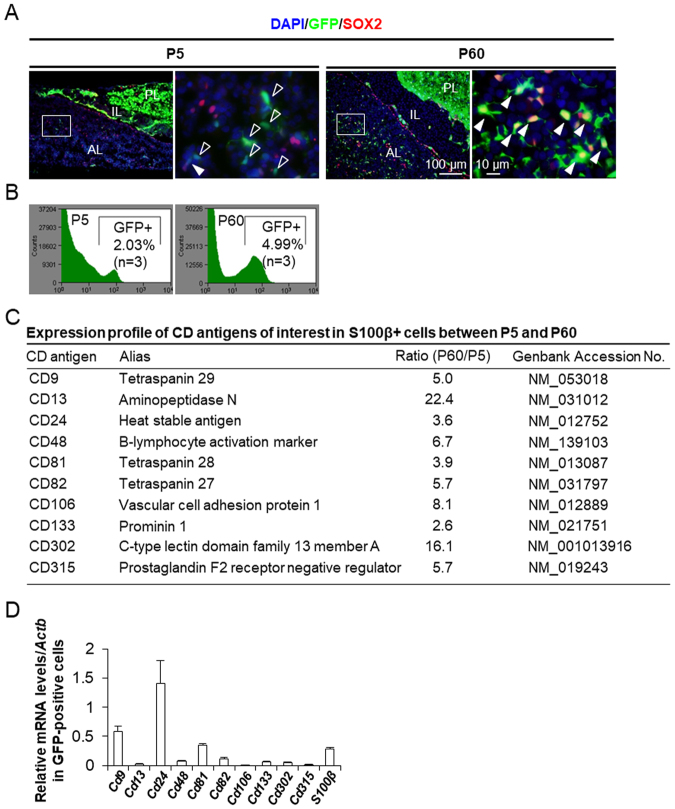
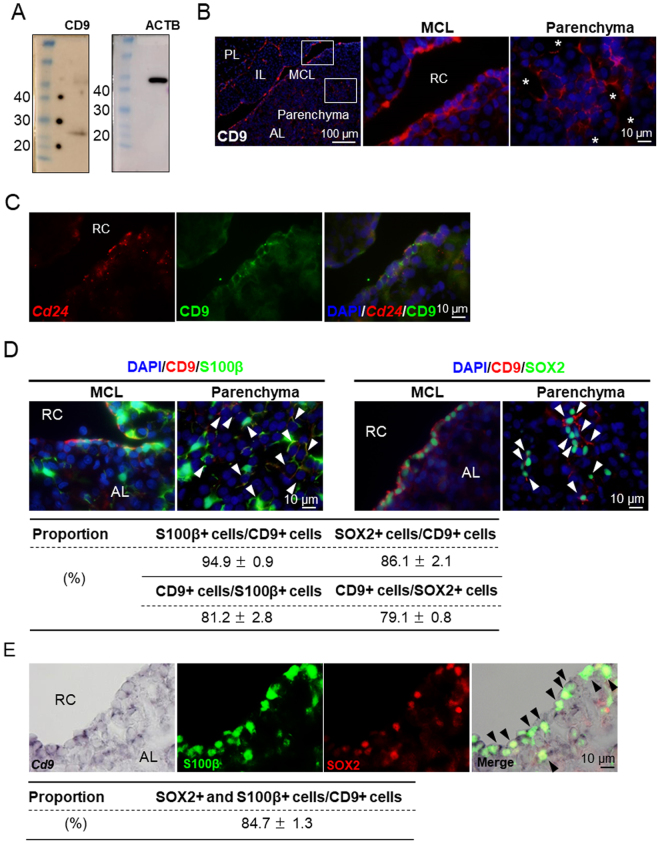
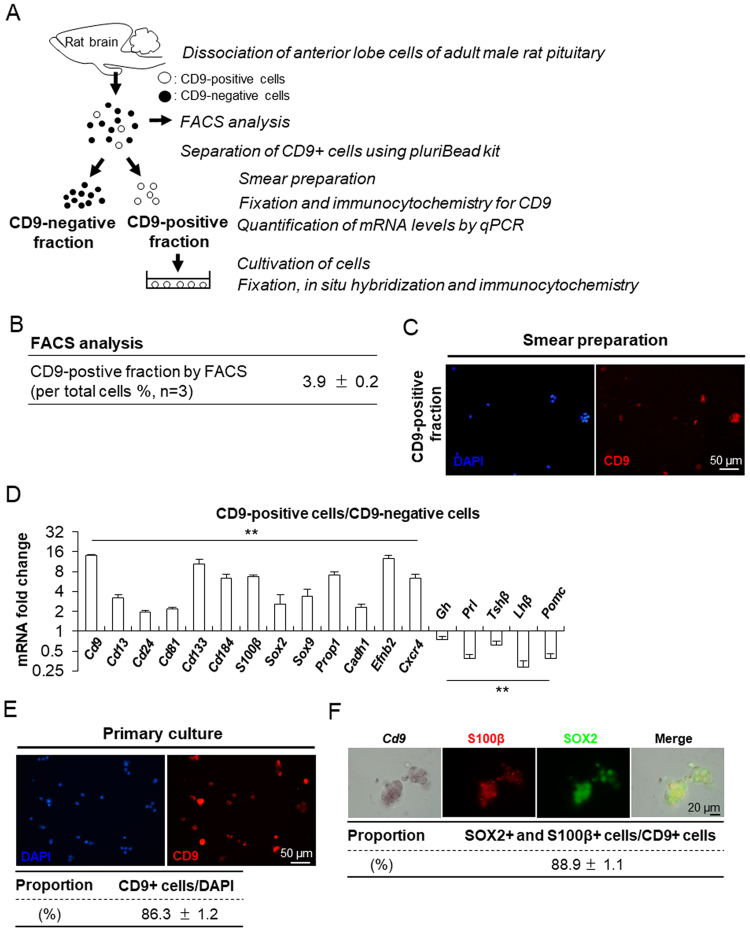
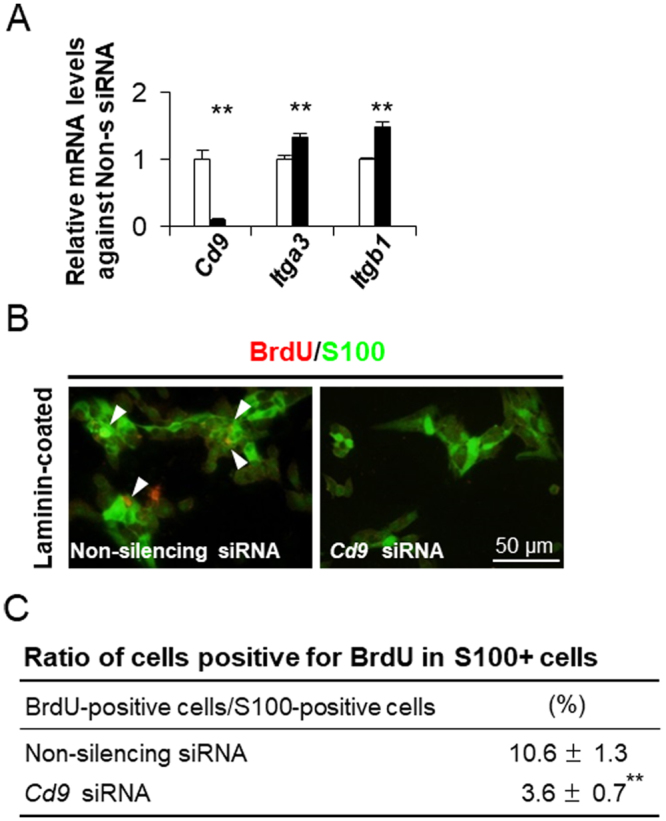
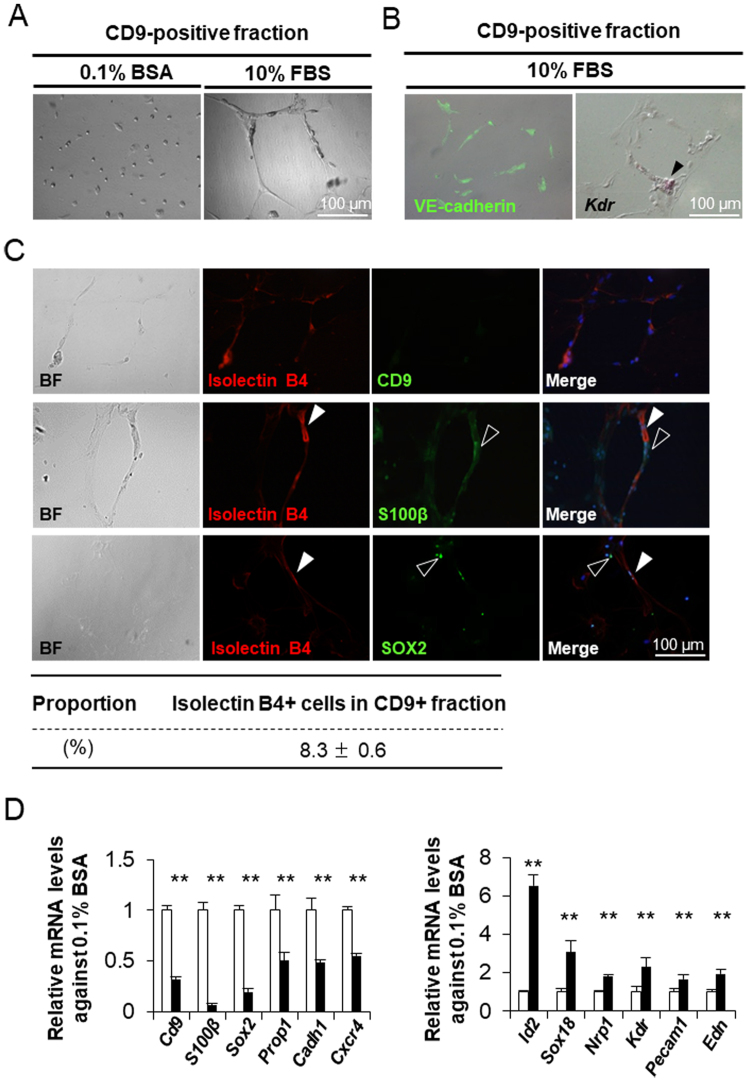
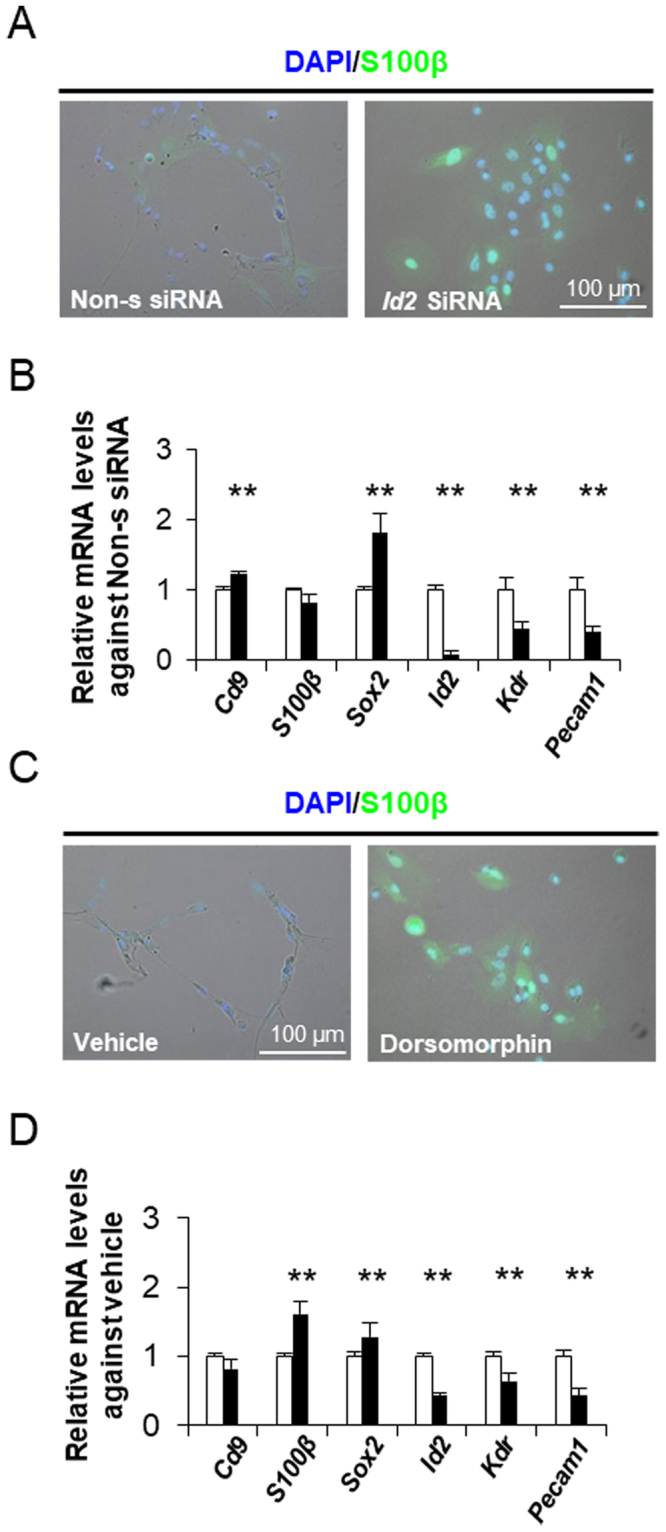
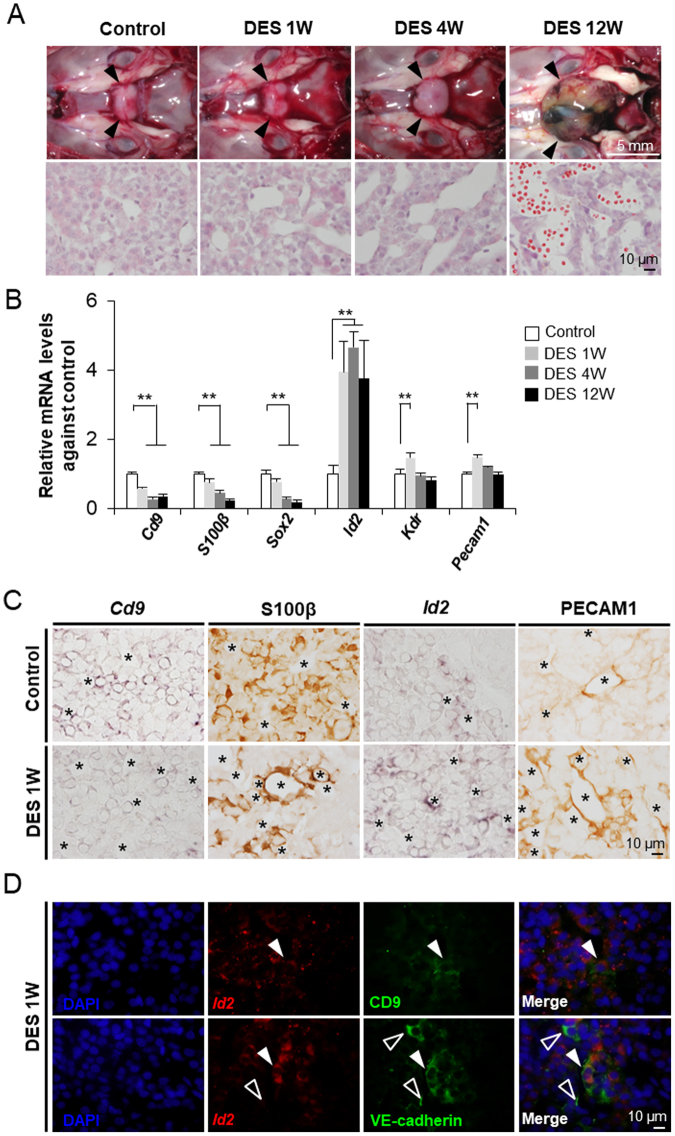
S100β protein and SOX2-double positive (S100β/SOX2-positive) cells have been suggested to be adult pituitary stem/progenitor cells exhibiting plasticity and multipotency. The aim of the present study was to isolate S100β/SOX2-positive cells from the adult anterior lobes of rats using a specific antibody against a novel membrane marker and to study their characteristics in vitro. We found that cluster of differentiation (CD) 9 is expressed in the majority of adult rat S100β/SOX2-positive cells, and we succeeded in isolating CD9-positive cells using an anti-CD9 antibody with a pluriBead-cascade cell isolation system. Cultivation of these cells showed their capacity to differentiate into endothelial cells via bone morphogenetic protein signalling. By using the anterior lobes of prolactinoma model rats, the localisation of CD9-positive cells was confirmed in the tumour-induced neovascularisation region. Thus, the present study provides novel insights into adult pituitary stem/progenitor cells involved in the vascularisation of the anterior lobe.


Conflict of interest statement

The authors declare no competing interests.

Figures

Figure 1
Figure 1
Expression profiles of CD antigens of interest in S100β-positive cells. (A) Immunofluorescence staining of SOX2 in the anterior lobe of S100β/GFP-TG rats at P5 and P60. Open white arrowheads indicate S100β-positive cells negative for SOX2. White arrowheads indicate S100β-positive cells positive for SOX2. Right images are high magnifications of boxed areas in left images at P5 and P60. AL, anterior lobe; IL, intermediate lobe; PL, posterior lobe. (B) GFP intensity of anterior pituitary cells from S100β/GFP-TG rats at P5 and P60, separated by a cell sorter. Numbers indicate gated cell frequencies (n = 3). (C) Comparative expression levels of CD antigens of interest from microarray data of S100β-positive cells at P5 and P60. (D) Expression levels of 10 CD genes and S100β mRNA in GFP-positive cells from S100β/GFP-TG rats at P60 as determined by qPCR and normalised with an internal control (β-actin gene, Actb).
Figure 2
Figure 2
Expression of CD9 in S100β-positive cells. (A) Merged images of full-length gels and transfer membranes from western blotting. CD9 (left) and β-actin (ACTB, right) proteins in the anterior lobe as determined from different gels. Molecular markers with their molecular weights (kDa) are indicated in the left lane of each panel. Exposure times were 3 min (CD9) and 2 min (β-actin). (B) Immunofluorescence staining of CD9 in the marginal cell layer (MCL) and parenchyma of the anterior lobes of adult male rats. Middle and right images are high magnifications of boxed areas in left images. AL, anterior lobe; IL, intermediate lobe; PL, posterior lobe. RC, Rathke’s cleft. Asterisks indicate blood vessels. (C) In situ hybridisation of Cd24 (red) and immunohistochemistry of CD9 (green). (D) Immunofluorescence staining of CD9 (red) in the MCL and parenchyma of anterior lobes from adult male S100β/GFP-TG rats and double immunofluorescence for CD9 and SOX2 in the anterior lobes of adult male rats. AL, anterior lobe. RC, Rathke’s cleft. White arrowheads indicate double-positive cells. Lower table shows the proportions of S100β-positive (S100β+) cells among CD9-positive (CD9+) cells, CD9+ cells among S100β+ cells, SOX2-positive (SOX2+) cells among CD9+ cells, and CD9+ cells among SOX2+ cells of the anterior lobe. Numbers of CD9, S100β, and SOX2-positive cells were counted in random areas of the anterior lobe, and the population of each type of cell was calculated for immunohistochemistry. (E) In situ hybridisation of Cd9 (left panel) and double immunofluorescence of S100β (green) and SOX2 (red) in the anterior lobes of adult male rats. Right panels show merged images of the three left panels. AL, anterior lobe. RC, Rathke’s cleft. Black arrowheads indicate triple-positive cells. Lower table shows the proportion of S100β and SOX2-double positive (S100β+ and SOX2+) cells among CD9-positive (CD9+) cells. Numbers of CD9, S100β, and SOX2-triple positive cells were counted in random areas of the anterior lobe, and the ratio of triple-positive cells to CD9+ cells was calculated for in situ hybridisation and immunohistochemistry.
Figure 3
Figure 3
Isolation of CD9-positive cells from the rat anterior lobe. (A) Schematic of the experimental steps for FACS analysis, preparation, and cultivation of CD9-positive cells. (B) The proportion of CD9-positive cells in rat anterior lobes at P60 estimated by FACS. (C) Immunofluorescence staining of CD9 in smear preparations from the CD9-positive fraction. (D) mRNA levels of the following genes in CD9-positive and -negative cells were determined by qPCR (mean ± SEM, n = 3), followed by normalisation with an internal control (Actb): Cd9, Cd13, Cd24, Cd81, Cd133, S100β, Sox2, Sox9, Prop1, Cadh1, Efnb2, Cxcr4, Gh (growth hormone), Prl (prolactin), Tshβ (thyroid-stimulating hormone-beta), Lhβ (luteinising hormone-beta), and Pomc (proopiomelanocortin). **P < 0.01. The vertical axes are scaled logarithmically. (E) Immunofluorescence staining of CD9 in the CD9-positive fraction cultured for 72 h on a non-coated surface with 10% FBS. The proportion of CD9-positive (CD9+) cells in the CD9-positive fraction separated by pluriBeads is indicated (mean ± SEM, n = 3) in the lower row. Numbers of CD9-positive cells were counted in random areas in primary culture wells, and the proportion of each type of cell was calculated. (F) In situ hybridisation of Cd9 (left panel) and double immunofluorescence of S100β (green) and SOX2 (red). The right panel shows a merged image of the three left panels. Numbers of CD9, S100β, and SOX2-triple positive cells were counted in random areas, and the ratio of triple-positive cells to CD9+ cells was calculated for in situ hybridisation and immunohistochemistry.
Figure 4
Figure 4
Down-regulation of Cd9 mRNA levels by siRNA transfection in CD9-positive cells. (A) Cd9, Itga3, and Itgb1 mRNA levels in CD9-positive cells cultured with non-silencing siRNAs (white bar) or Cd9-siRNAs (black bar) for 48 h as determined by qPCR (mean ± SEM, n = 3), followed by normalisation with an internal control (Actb). **P < 0.01. (B) Merged image of immunocytochemistry of S100β (green) and BrdU (red) for 24 h after CD9-positive cells were transfected with non-silencing (left) and Cd9 (right) siRNAs for 48 h and re-plated. (C) The ratio of cells immuno-positive for BrdU among CD9-positive cells. **P < 0.01.
Figure 5
Figure 5
Differentiation of CD9-positive cells into endothelial cells. (A) Bright field images of primary cultured CD9-positive cells cultured for 120 h on laminin-coated surfaces in medium with 0.1% BSA (left) or 10% FBS (right) at 2.0 × 104 cells/cm2. (B) Immunocytochemistry of VE-cadherin (left, green) and in situ hybridisation of Kdr (right, arrowhead) after cultivation of CD9-positive cells for 120 h with 10% FBS. (C) Double-staining of isolectin B4 with CD9 (upper row), S100β (middle row), and SOX2 (lower row) in rat CD9-positive cells after primary culture for 120 h with 10% FBS. (D) Relative ratio of mRNA levels of the following genes after primary culture of CD9-positive cells with 10% FBS (white bar) or 0.1% BSA (black bar) as determined by qPCR (mean ± SEM, n = 3), followed by normalisation with an internal control (Actb): Left graph: Cd9, S100β, Sox2, Prop1, Cadh1, and Cxcr4. Right graph: Id2, Sox18, Nrp1, Kdr, Pecam1, and Edn.
Figure 6
Figure 6
Signalling pathway responsible for endothelial cell differentiation in CD9-positive cells. (A) Downregulation of Id2 by siRNA treatment. Immunocytochemistry of S100β protein (green) 96 h following transfection of CD9-positive cells with Id2 siRNAs. (B) mRNA expression levels of Cd9, S100β, Sox2, Id2, Kdr, and Pecam1 72 h after transfection of CD9-positive cells with Id2 siRNAs (black bar) or non-silencing siRNA (white bar; mean ± SEM, n = 3). **P < 0.01. (C) Downregulation of BMP signalling by dorsomorphin. Immunocytochemistry of S100β in CD9-positive cells treated for 120 h with vehicle or dorsomorphin. (D) mRNA levels after primary culture of CD9-positive cells at 2.0 × 104 cells/cm2 for 120 h with vehicle (white bar) or dorsomorphin (black bar) as determined by qPCR (mean ± SEM, n = 3), followed by normalisation with an internal control (Actb). **P < 0.01.
Figure 7
Figure 7
Change in the expression level of Cd9 in the anterior lobes of prolactinoma model rats. (A) The upper row shows images of the pituitary glands of control (Control) rats and those treated with DES for 1 (DES 1 W), 4 (DES 4 W), and 12 weeks (DES 12 W). The lower row shows HE staining of the pituitary glands of control (Control) and male rats treated with DES for 1 (DES 1 W), 4 (DES 4 W), and 12 weeks (DES 12 W). (B) Cd9, S100β, Sox2, Id2, Kdr, and Pecam1 mRNA levels after DES treatment as estimated by qPCR (mean ± SEM, n = 3), followed by normalisation with an internal control (Actb). **P < 0.01. (C) In situ hybridisation of Cd9 and Id2 and immunohistochemistry of S100β protein and PECAM1 in the anterior lobes of control (Control) and male rats treated with DES for 12 weeks (DES 12 W). Asterisks indicate blood capillaries. (D) Double-staining of Id2 via in situ hybridisation and CD9 or VE-cadherin via immunohistochemistry in the anterior lobes of male rats treated with DES for 1 week are shown in the upper and lower rows, respectively. White arrowheads indicate double-positive cells. Open white arrowheads indicate single-positive cells.

References

    1. Goodell MA, Brose K, Paradis G, Conner AS, Mulligan RC. Isolation and functional properties of murine hematopoietic stem cells that are replicating in vivo. J Exp Med. 1996;183:1797–1806. doi: 10.1084/jem.183.4.1797. - DOI - PMC - PubMed
    1. Chen J, et al. The adult pituitary contains a cell population displaying stem/progenitor cell and early embryonic characteristics. Endocrinology. 2005;146:3985–3998. doi: 10.1210/en.2005-0185. - DOI - PubMed
    1. Chen J, et al. Pituitary progenitor cells tracked down by side population dissection. Stem Cells. 2009;27:1182–1195. doi: 10.1002/stem.51. - DOI - PubMed
    1. Fauquier T, Rizzoti K, Dattani M, Lovell-Badge R, Robinson IC. SOX2-expressing progenitor cells generate all of the major cell types in the adult mouse pituitary gland. Proc Natl Acad Sci USA. 2008;105:2907–2912. doi: 10.1073/pnas.0707886105. - DOI - PMC - PubMed
    1. Andoniadou CL, et al. Sox2(+) stem/progenitor cells in the adult mouse pituitary support organ homeostasis and have tumor-inducing potential. Cell Stem Cell. 2013;13:433–445. doi: 10.1016/j.stem.2013.07.004. - DOI - PubMed

Publication types

MeSH terms

Substances

LinkOut - more resources