

doi: 10.2807/1560-7917.ES.2018.23.13.18-00146.
Dominant influenza A(H3N2) and B/Yamagata virus circulation in EU/EEA, 2016/17 and 2017/18 seasons, respectively
Affiliations
- PMID: 29616611
- PMCID: PMC5883452
- DOI: 10.2807/1560-7917.ES.2018.23.13.18-00146
Item in Clipboard
Dominant influenza A(H3N2) and B/Yamagata virus circulation in EU/EEA, 2016/17 and 2017/18 seasons, respectively
Euro Surveill.
2018 Mar.
Abstract
We use surveillance data to describe influenza A and B virus circulation over two consecutive seasons with excess all-cause mortality in Europe, especially in people aged 60 years and older. Influenza A(H3N2) virus dominated in 2016/17 and B/Yamagata in 2017/18. The latter season was prolonged with positivity rates above 50% among sentinel detections for at least 12 weeks. With a current west-east geographical spread, high influenza activity might still be expected in eastern Europe.
Keywords: Europe; epidemiology; influenza; intensive care; mortality; severity; surveillance.
Conflict of interest statement
Figures
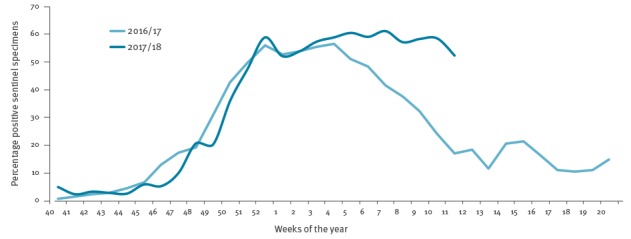
Percentage positivity for influenza viruses among sentinel specimens, by week and season, European Union/European Economic Area, 2016/17 and 2017/18 (up to week 11)
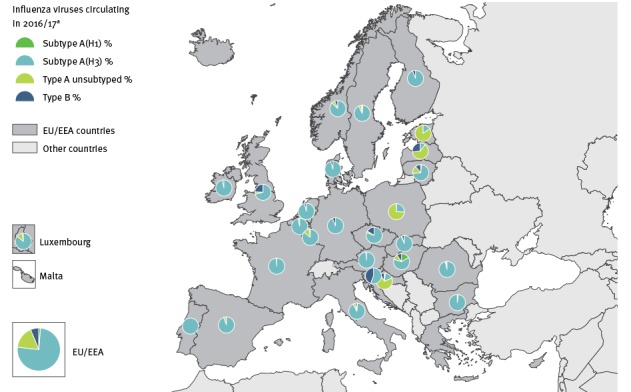
Distribution of viral types/subtypes in sentinel specimens by country, European Union/European Economic Area, influenza season 2016/17
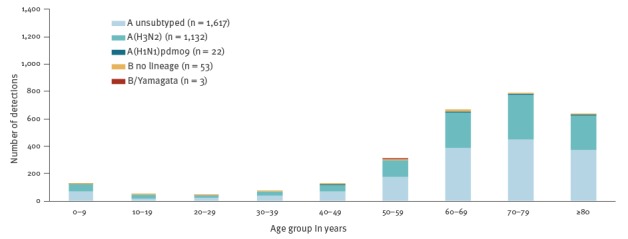
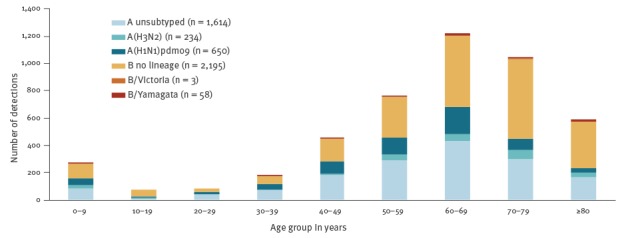
Distribution of laboratory-confirmed influenza cases admitted to ICU, by age group and type/subtype, in the reporting European Union/European Economic Area countries, 2016/17 season (n = 2,827 patients)a
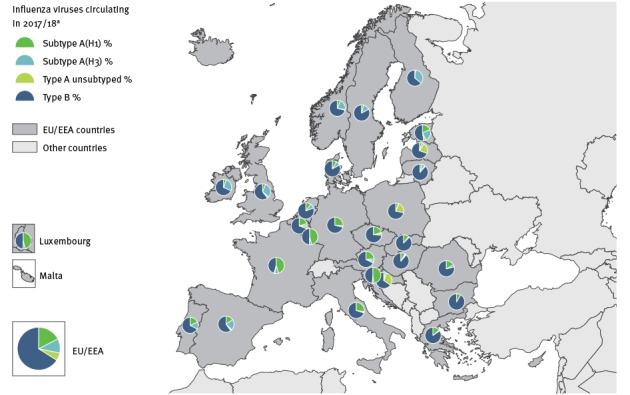
Distribution of viral types/subtypes in sentinel specimens by country, European Union/European Economic Area, influenza season 2017/18 (up to week 11)
Distribution of laboratory-confirmed influenza cases admitted to ICU, by age group and type/subtype, in the reporting European Union/European Economic Area countries, 2017/18 season (up to week 11) (n = 4,754)a
References
-
- European monitoring of excess mortality for public health action - EuroMOMO. Copenhagen: EuroMOMO. [Accessed 23 Mar 2018]. Available from: http://www.euromomo.eu/index.html
-
- European Centre for Disease Prevention and Control (ECDC) and World Health Organization (WHO) Regional Office for Europe. Flu News Europe - Joint ECDC-WHO/Europe weekly influenza update, Archives season 2017-18. Week 11/2018 (12–18 March 2018). ECDC/WHO. Available from: http://flunewseurope.org/Archives
-
- Paget J, Marquet R, Meijer A, van der Velden K. Influenza activity in Europe during eight seasons (1999-2007): an evaluation of the indicators used to measure activity and an assessment of the timing, length and course of peak activity (spread) across Europe. BMC Infect Dis. 2007;7(1):141. 10.1186/1471-2334-7-141 - DOI - PMC - PubMed
MeSH terms
LinkOut - more resources
Full Text Sources
Other Literature Sources
Medical