. 2018 Apr 4;23(4):829.
doi: 10.3390/molecules23040829.

Exosome-Mediated Transfer of Cancer Cell Resistance to Antiestrogen Drugs

Affiliations

Exosome-Mediated Transfer of Cancer Cell Resistance to Antiestrogen Drugs

Svetlana E Semina et al. Molecules. .

Abstract

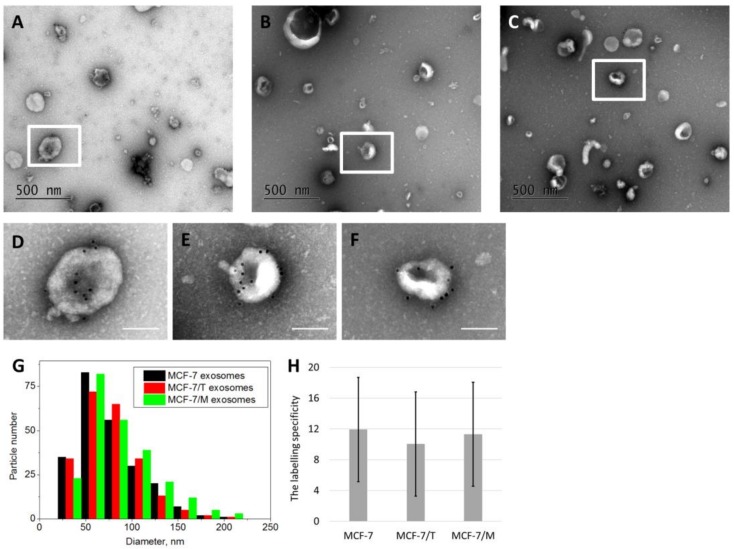
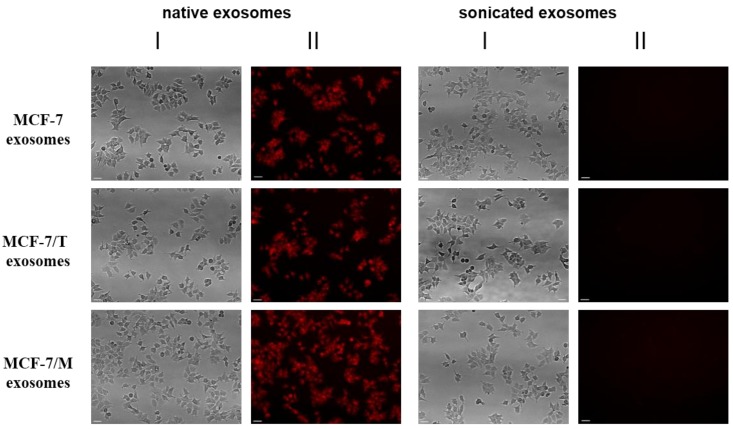
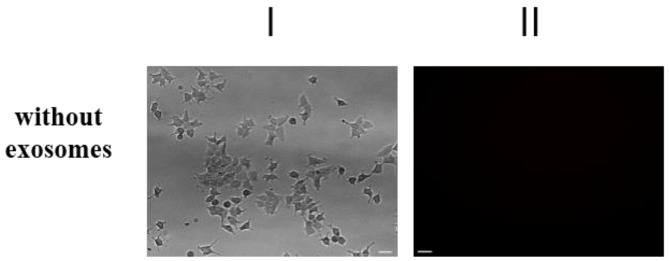
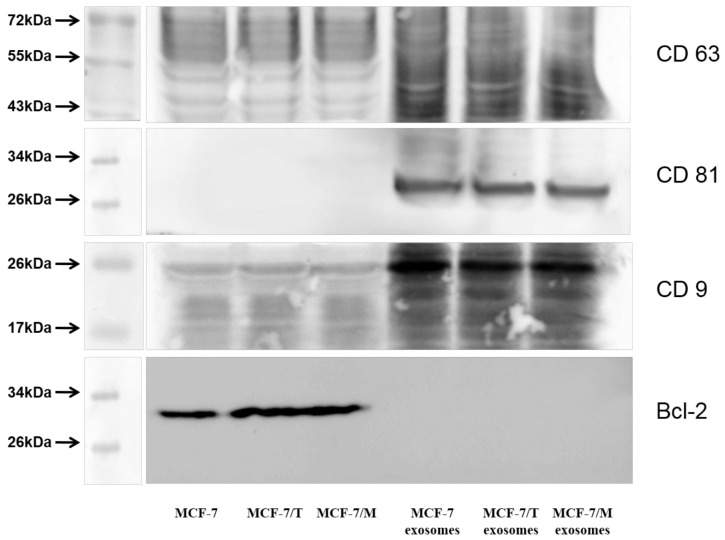
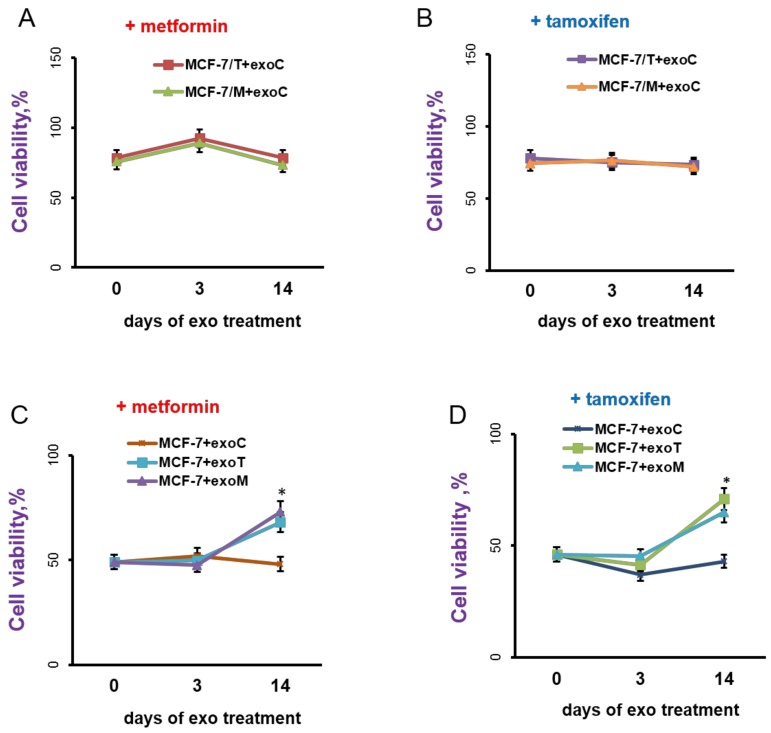
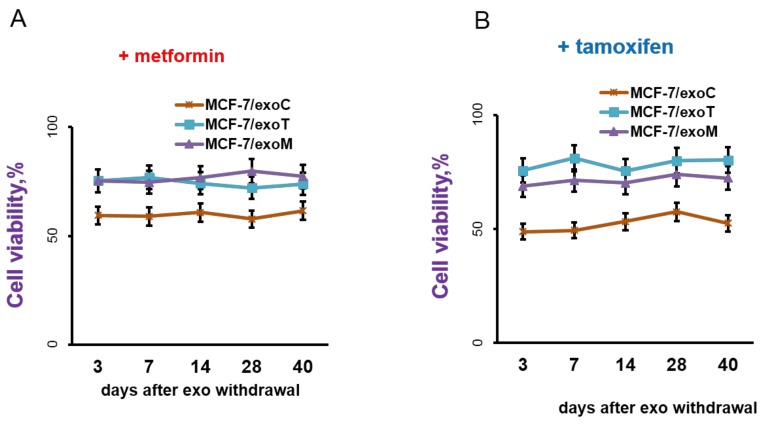
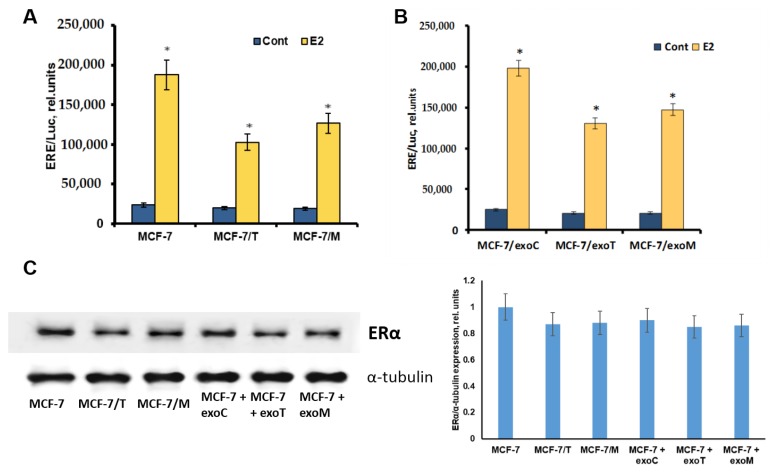
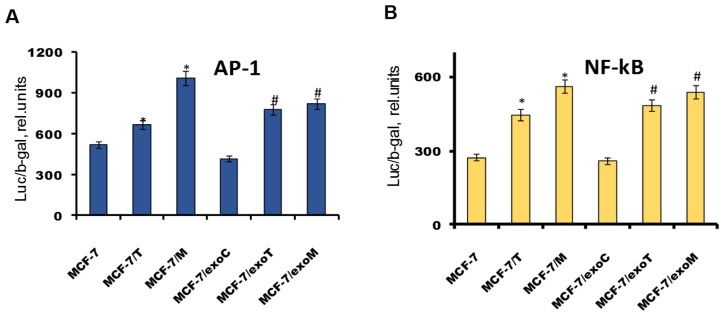
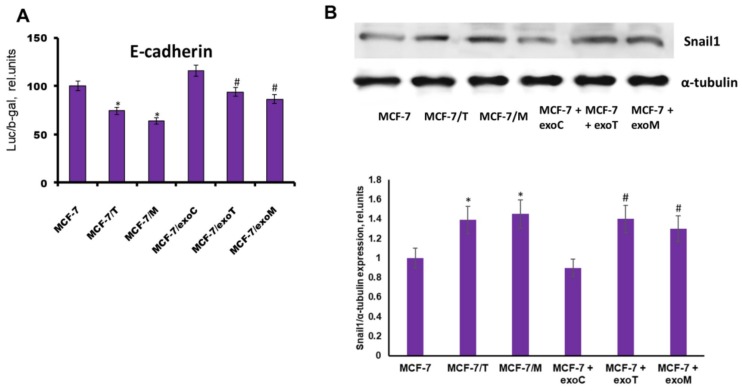
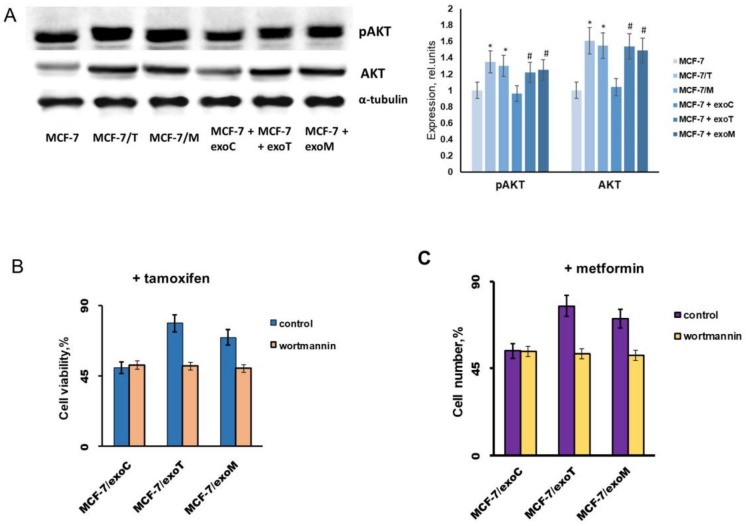
Exosomes are small vesicles which are produced by the cells and released into the surrounding space. They can transfer biomolecules into recipient cells. The main goal of the work was to study the exosome involvement in the cell transfer of hormonal resistance. The experiments were performed on in vitro cultured estrogen-dependent MCF-7 breast cancer cells and MCF-7 sublines resistant to SERM tamoxifen and/or biguanide metformin, which exerts its anti-proliferative effect, at least in a part, via the suppression of estrogen machinery. The exosomes were purified by differential ultracentrifugation, cell response to tamoxifen was determined by MTT test, and the level and activity of signaling proteins were determined by Western blot and reporter analysis. We found that the treatment of the parent MCF-7 cells with exosomes from the resistant cells within 14 days lead to the partial resistance of the MCF-7 cells to antiestrogen drugs. The primary resistant cells and the cells with the exosome-induced resistance were characterized with these common features: decrease in ERα activity and parallel activation of Akt and AP-1, NF-κB, and SNAIL1 transcriptional factors. In general, we evaluate the established results as the evidence of the possible exosome involvement in the transferring of the hormone/metformin resistance in breast cancer cells.

Keywords: SERM; breast cancer; exosomes; resistance; tamoxifen.


Conflict of interest statement

The authors declare no conflict of interest regarding this article.

Figures

Figure 1
Figure 1
The characteristics of the resistant cell sublines. Cell sensitivity to tamoxifen and metformin. The cells were treated with 5 μM SERM tamoxifen or 10 mM biguanide metformin for 3 days and the amount of the viable cells was assessed by the MTT-test. Data represent mean value ± S.D. of three independent experiments. 100% was set as the viability of cells treated with vehicle control.
Figure 2
Figure 2
The transmission electron microscopy of the exosomes. Exosomes were prepared from the conditioned medium by the differential ultracentrifugation, labeled by the gold nanoparticles, and imaged as described in Methods. (AC) Wide-field images of the exosomes from MCF-7, MCF-7/T and MCF-7/M cells correspondingly. (DF) The magnified fragments, scale bar 100 nm. (G) Exosome size distributions obtained by processing of the TEM images. (H) The labelling specificity of the exosomes in the three samples obtained from MCF-7, MCF-7/T and MCF-7/M cells. The error bars correspond to S.D.
Figure 3
Figure 3
Transferring of fluorescent-labeled compounds by exosomes. Exosomes were stained by fluorescent drug (CellTracker™ Red CMPTX Dye) in according to the manufacturer’s procedure, then washed twice by the ultracentrifugation 100,000× g and incubated with MCF-7 cells. As a control labeled exosomes after sonication were used. The non-specific labeling of cell was checked by the fluorescent dye which was spun alone. The efficiency of dyeing exosome incorporation was checked with fluorescent microscope Nikon Eclipse Ti-E (Plan 10×/0.25; ORCA-ER camera by Hamamatsu Photonics; NIS-Elements AR 2.3 software by Nikon). Exposition for fluorescence was 4 s. Scale bar 50 µm. The images of light (I) and fluorescent (II) microscopy are presented.
Figure 3
Figure 3
Transferring of fluorescent-labeled compounds by exosomes. Exosomes were stained by fluorescent drug (CellTracker™ Red CMPTX Dye) in according to the manufacturer’s procedure, then washed twice by the ultracentrifugation 100,000× g and incubated with MCF-7 cells. As a control labeled exosomes after sonication were used. The non-specific labeling of cell was checked by the fluorescent dye which was spun alone. The efficiency of dyeing exosome incorporation was checked with fluorescent microscope Nikon Eclipse Ti-E (Plan 10×/0.25; ORCA-ER camera by Hamamatsu Photonics; NIS-Elements AR 2.3 software by Nikon). Exposition for fluorescence was 4 s. Scale bar 50 µm. The images of light (I) and fluorescent (II) microscopy are presented.
Figure 4
Figure 4
Immunoblotting of exosomal markers CD9, CD63, CD81 in the exosome samples from MCF-7, MCF-7/T and MCF-7/M cells versus cell lines MCF-7, MCF-7/T and MCF-7/M. As a non-exosomal marker was chosen Bcl-2 protein. The blot represents the results of one of the three similar experiments. The western blot analysis of exosome samples versus cell included non-reducing condition and a sample buffer did not contain β-mercaptoethanol.
Figure 5
Figure 5
Exosomes influence on the cell response to metformin and tamoxifen. (A,B) The resistant MCF-7/T and MCF-7/M cells were cultured without exosomes or in the presence of the control exosomes from MCF-7 cells for 3 or 14 days, then the cells were treated with 5 μM tamoxifen or 10 mM metformin for 3 days and the amount of the viable cells was counted by the MTT-test. (C,D) The MCF-7 cells were cultured in the presence of the exosomes from MCF-7, MCF-7/T or MCF-7/M cells for 3 or 14 days, then the cell response to metformin and tamoxifen was determined as described above. Data represent mean value ± S.D. of three independent experiments. Сell viability (%) was expressed as a percentage relative to cells treated with vehicle control. * p < 0.05 versus MCF-7 + exoC.
Figure 6
Figure 6
Exosome withdrawal and cell response to metformin and tamoxifen. MCF-7 cells after 14 days’ treatment by exosomes from MCF-7, MCF-7/T or MCF-7/M cells (named as MCF-7/exoC, MCF-7/exoT and MCF-7/exoM cells, respectively) were transferred to standard exosome-free medium and cell sensitivity to metformin (A) and tamoxifen (B) was regularly measured within 40 days of growth.
Figure 7
Figure 7
Expression and transcriptional activity of ERα. All experiments were performed on the donor MCF-7, MCF-7/T, MCF-7/M cells (A) and MCF-7/exoC, MCF-7/exoT, MCF-7/exoM cells treated with the respective exosomes for 14 days with following exosome withdrawal for 40 days (B). Transcriptional activity of ERα was determined by reporter assay. The cells were transfected with the ERE-LUC plasmid containing the luciferase reporter gene under the estrogen responsive element (ERE), and β-galactosidase plasmid. 24 h after transfection the luciferase and β-galactosidase activities were determined as described in the Methods section. The relative luciferase activity was calculated in arbitrary units as the ratio of the luciferase to the galactosidase activity. Data represent mean value ± S.D. of three independent experiments. * p < 0.05 versus control (-E2) (C) Western blot analysis of ERα in total cell extracts. Protein loading was controlled by membrane hybridization with α-tubulin Abs. The blot represents the results of one of the three similar experiments. Densitometry was performed using ImageJ (NIH) software with the protocol provided by The University of Queensland. Densitometry data represent mean value ± S.D. of three independent experiments.
Figure 8
Figure 8
Transcriptional activity of AP-1 and NF-κB. The cell lines were similar to that in Figure 5. Transcriptional activity of AP-1 (A) and NF-κB (B) was determined by reporter assay. The cells were transfected with the AP-1 or NF-κB plasmid containing the luciferase reporter gene under the AP-1 or NF-κB-responsive elements, and β-galactosidase plasmid. 24 h after transfection the luciferase and β-galactosidase activities were determined as described above. Data represent mean value ± S.D. of three independent experiments. * p < 0.05 versus MCF-7, # p < 0.05 versus MCF-7/exoC.
Figure 9
Figure 9
Expression and transcriptional activity of Snail1. The cell lines were similar to that in Figure 5. (A) Transcriptional activity of Snail1 was determined by reporter assay. The reporter assay was based on the Snail1 ability to inhibit the expression of the transfected luciferase reporter gene contained Snail-responsive elements from E-cadherin promoter (E-cad/Luc). The transfection efficiency was controlled by co-transfection of the cells with plasmid containing the β-galactosidase gene, luciferase activity was determined as described in the Methods section. Data represent mean value ± S.D. of three independent experiments. * p < 0.05 versus MCF-7, # p < 0.05 versus MCF-7/exoC. (B) Western blot analysis of Snail1 in total cell extracts. Protein loading was controlled by membrane hybridization with α-tubulin Abs. Densitometry was performed using ImageJ (NIH) software. Densitometry data represent mean value ± S.D. of three independent experiments. * p < 0.05 versus MCF-7, # p < 0.05 versus MCF-7 + exoC.
Figure 10
Figure 10
PI3K/Akt signaling and cell resistance. (A) Western blot analysis of pAkt and Akt in total cell extracts. The cell lines were similar to that in Figure 5. Protein loading was controlled by membrane hybridization with α-tubulin Abs. The blot represents the results of one of the three similar experiments. Densitometry was performed using ImageJ (NIH) software. * p < 0.05 versus MCF-7, # p < 0.05 versus MCF-7 + exoC. (B,C) Wortmannin influence on the exosome-mediated resistance. MCF-7 cells were treated with the control MCF-7 or “resistant” MCF-7/T and MCF-7/M exosomes within 14 days in the absence or presence 5 × 10⁻⁶ M wortmannin with subsequent determination of cell growth response to tamoxifen (B) or metformin (C).

References

    1. Osborne C.K., Schiff R. Mechanisms of endocrine resistance in breast cancer. Annu. Rev. Med. 2011;62:233–247. doi: 10.1146/annurev-med-070909-182917. - DOI - PMC - PubMed
    1. Roop R.P., Ma C.X. Endocrine resistance in breast cancer: Molecular pathways and rational development of targeted therapies. Future Oncol. 2012;8:273–292. doi: 10.2217/fon.12.8. - DOI - PubMed
    1. Fox E.M., Arteaga C.L., Miller T.W. Abrogating endocrine resistance by targeting ERalpha and PI3K in breast cancer. Front. Oncol. 2012;2:145. doi: 10.3389/fonc.2012.00145. - DOI - PMC - PubMed
    1. Riggins R.B., Bouton A.H., Liu M.C., Clarke R. Antiestrogens, aromatase inhibitors, and apoptosis in breast cancer. Vitam. Horm. 2005;71:201–237. - PubMed
    1. Krasil’nikov M.A. Modern approaches to estrogen-independent growth of breast tumor. Vopr. Onkol. 2004;50:399–405. - PubMed

MeSH terms

LinkOut - more resources