

Spatial Organization and Molecular Correlation of Tumor-Infiltrating Lymphocytes Using Deep Learning on Pathology Images
- PMID: 29617659
- PMCID: PMC5943714
- DOI: 10.1016/j.celrep.2018.03.086
Spatial Organization and Molecular Correlation of Tumor-Infiltrating Lymphocytes Using Deep Learning on Pathology Images
Abstract
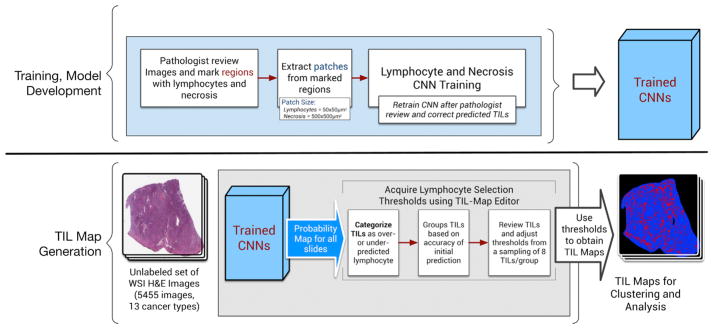
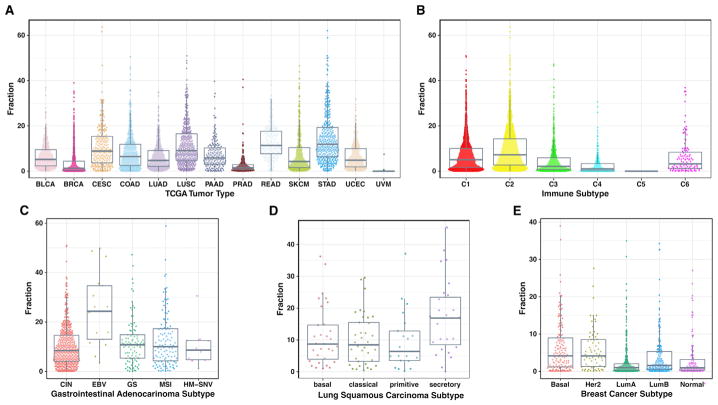
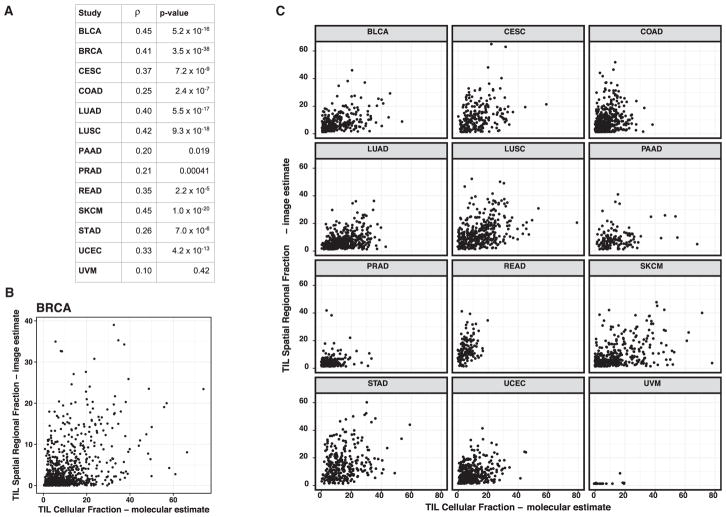
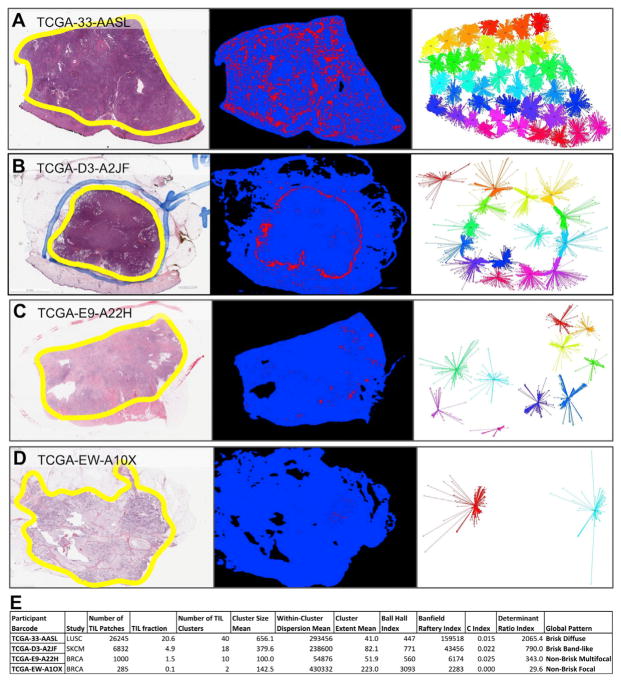
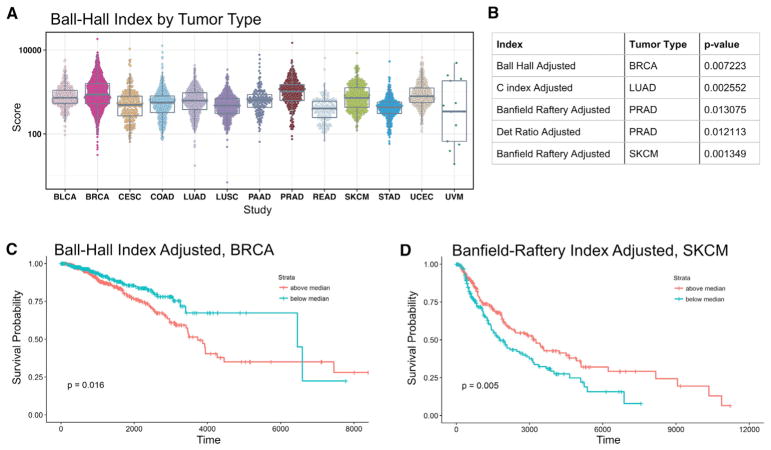
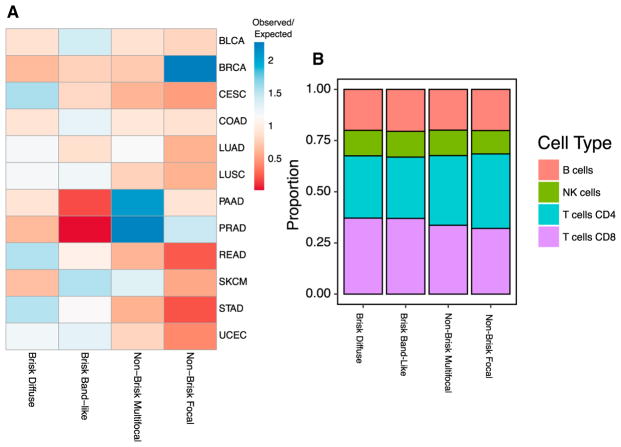
Beyond sample curation and basic pathologic characterization, the digitized H&E-stained images of TCGA samples remain underutilized. To highlight this resource, we present mappings of tumor-infiltrating lymphocytes (TILs) based on H&E images from 13 TCGA tumor types. These TIL maps are derived through computational staining using a convolutional neural network trained to classify patches of images. Affinity propagation revealed local spatial structure in TIL patterns and correlation with overall survival. TIL map structural patterns were grouped using standard histopathological parameters. These patterns are enriched in particular T cell subpopulations derived from molecular measures. TIL densities and spatial structure were differentially enriched among tumor types, immune subtypes, and tumor molecular subtypes, implying that spatial infiltrate state could reflect particular tumor cell aberration states. Obtaining spatial lymphocytic patterns linked to the rich genomic characterization of TCGA samples demonstrates one use for the TCGA image archives with insights into the tumor-immune microenvironment.
Keywords: artificial intelligence; bioinformatics; computer vision; deep learning; digital pathology; immuno-oncology; lymphocytes; machine learning; tumor microenvironment; tumor-infiltrating lymphocytes.
Copyright © 2018 The Authors. Published by Elsevier Inc. All rights reserved.
Conflict of interest statement
Michael Seiler, Peter G. Smith, Ping Zhu, Silvia Buonamici, and Lihua Yu are employees of H3 Biomedicine, Inc. Parts of this work are the subject of a patent application: WO2017040526 titled “Splice variants associated with neo-morphic sf3b1 mutants.” Shouyoung Peng, Anant A. Agrawal, James Palacino, and Teng Teng are employees of H3 Biomedicine, Inc. Andrew D. Cherniack, Ashton C. Berger, and Galen F. Gao receive research support from Bayer Pharmaceuticals. Gordon B. Mills serves on the External Scientific Review Board of Astrazeneca. Anil Sood is on the Scientific Advisory Board for Kiyatec and is a shareholder in BioPath. Jonathan S. Serody receives funding from Merck, Inc. Kyle R. Covington is an employee of Castle Biosciences, Inc. Preethi H. Gunaratne is founder, CSO, and shareholder of NextmiRNA Therapeutics. Christina Yau is a part-time employee/consultant at NantOmics. Franz X. Schaub is an employee and shareholder of SEngine Precision Medicine, Inc. Carla Grandori is an employee, founder, and shareholder of SEngine Precision Medicine, Inc. Robert N. Eisenman is a member of the Scientific Advisory Boards and shareholder of Shenogen Pharma and Kronos Bio. Daniel J. Weisenberger is a consultant for Zymo Research Corporation. Joshua M. Stuart is the founder of Five3 Genomics and shareholder of NantOmics. Marc T. Goodman receives research support from Merck, Inc. Andrew J. Gentles is a consultant for Cibermed. Charles M. Perou is an equity stock holder, consultant, and Board of Directors member of BioClassifier and GeneCentric Diagnostics and is also listed as an inventor on patent applications on the Breast PAM50 and Lung Cancer Subtyping assays. Matthew Meyerson receives research support from Bayer Pharmaceuticals; is an equity holder in, consultant for, and Scientific Advisory Board chair for OrigiMed; and is an inventor of a patent for EGFR mutation diagnosis in lung cancer, licensed to LabCorp. Eduard Porta-Pardo is an inventor of a patent for domainXplorer. Han Liang is a shareholder and scientific advisor of Precision Scientific and Eagle Nebula. Da Yang is an inventor on a pending patent application describing the use of antisense oligonucleotides against specific lncRNA sequence as diagnostic and therapeutic tools. Yonghong Xiao was an employee and shareholder of TESARO, Inc. Bin Feng is an employee and shareholder of TESARO, Inc. Carter Van Waes received research funding for the study of IAP inhibitor ASTX660 through a Cooperative Agreement between NIDCD, NIH, and Astex Pharmaceuticals. Raunaq Malhotra is an employee and shareholder of Seven Bridges, Inc. Peter W. Laird serves on the Scientific Advisory Board for AnchorDx. Joel Tepper is a consultant at EMD Serono. Kenneth Wang serves on the Advisory Board for Boston Scientific, Microtech, and Olympus. Andrea Califano is a founder, shareholder, and advisory board member of DarwinHealth, Inc. and a shareholder and advisory board member of Tempus, Inc. Toni K. Choueiri serves as needed on advisory boards for Bristol-Myers Squibb, Merck, and Roche. Lawrence Kwong receives research support from Array BioPharma. Sharon E. Plon is a member of the Scientific Advisory Board for Baylor Genetics Laboratory. Beth Y. Karlan serves on the Advisory Board of Invitae.
Figures
Comment in
-
Role of artificial intelligence in integrated analysis of multi-omics and imaging data in cancer research.Transl Cancer Res. 2019 Dec;8(8):E7-E10. doi: 10.21037/tcr.2019.12.17. Transl Cancer Res. 2019. PMID: 35117055 Free PMC article. No abstract available.
References
-
- Angell H, Galon J. From the immune contexture to the Immunoscore: the role of prognostic and predictive immune markers in cancer. Curr Opin Immunol. 2013;25:261–267. - PubMed
-
- Bailey P, Chang DK, Nones K, Johns AL, Patch AM, Gingras MC, Miller DK, Christ AN, Bruxner TJC, Quinn MC, et al. Australian Pancreatic Cancer Genome Initiative. Genomic analyses identify molecular subtypes of pancreatic cancer. Nature. 2016;531:47–52. - PubMed
-
- Ball GH, Hall DJ. Technical Report April 1965 prepared for the Information Sciences Branch of the Office of Naval Research. Stanford Research Institute - Clearinghouse for Federal Scientific and Technical Information; 1965. ISODATA, a novel method of data analysis and pattern classification; pp. 2–50.
-
- Banfield JD, Raftery AE. Model-Based Gaussian and Non-Gaussian Clustering. Biometrics. 1993;49:803–821.
-
- Bayramoglu N, Heikkila J. Transfer learning for cell nuclei classification in histopathology images. In: Hua G, Jégou H, editors. Computer Vision – ECCV 2016 Workshops. Springer; 2016. pp. 532–539. Lecture Notes in Computer Science.
Publication types
MeSH terms
Grants and funding
- P30 CA016672/CA/NCI NIH HHS/United States
- U24 CA143882/CA/NCI NIH HHS/United States
- U24 CA143866/CA/NCI NIH HHS/United States
- U54 HG003273/HG/NHGRI NIH HHS/United States
- U24 CA144025/CA/NCI NIH HHS/United States
- U24 CA143840/CA/NCI NIH HHS/United States
- U24 CA143843/CA/NCI NIH HHS/United States
- U24 CA143858/CA/NCI NIH HHS/United States
- U24 CA143848/CA/NCI NIH HHS/United States
- U24 CA210949/CA/NCI NIH HHS/United States
- R01 CA163722/CA/NCI NIH HHS/United States
- R50 CA221675/CA/NCI NIH HHS/United States
- U54 HG003067/HG/NHGRI NIH HHS/United States
- U24 CA143835/CA/NCI NIH HHS/United States
- R01 LM009239/LM/NLM NIH HHS/United States
- U24 CA180924/CA/NCI NIH HHS/United States
- U24 CA210950/CA/NCI NIH HHS/United States
- U24 CA143845/CA/NCI NIH HHS/United States
- U24 CA143799/CA/NCI NIH HHS/United States
- U24 CA210957/CA/NCI NIH HHS/United States
- U54 HG003079/HG/NHGRI NIH HHS/United States
- U24 CA210969/CA/NCI NIH HHS/United States
- U24 CA143883/CA/NCI NIH HHS/United States
- U24 CA143867/CA/NCI NIH HHS/United States
- U24 CA199461/CA/NCI NIH HHS/United States
- U24 CA215109/CA/NCI NIH HHS/United States
- U24 CA210990/CA/NCI NIH HHS/United States
LinkOut - more resources
Full Text Sources
Other Literature Sources
