. 2018 Apr 3;23(1):194-212.e6.
doi: 10.1016/j.celrep.2018.03.063.

Genomic, Pathway Network, and Immunologic Features Distinguishing Squamous Carcinomas

Collaborators, Affiliations

Genomic, Pathway Network, and Immunologic Features Distinguishing Squamous Carcinomas

Joshua D Campbell et al. Cell Rep. .

Abstract

This integrated, multiplatform PanCancer Atlas study co-mapped and identified distinguishing molecular features of squamous cell carcinomas (SCCs) from five sites associated with smoking and/or human papillomavirus (HPV). SCCs harbor 3q, 5p, and other recurrent chromosomal copy-number alterations (CNAs), DNA mutations, and/or aberrant methylation of genes and microRNAs, which are correlated with the expression of multi-gene programs linked to squamous cell stemness, epithelial-to-mesenchymal differentiation, growth, genomic integrity, oxidative damage, death, and inflammation. Low-CNA SCCs tended to be HPV(+) and display hypermethylation with repression of TET1 demethylase and FANCF, previously linked to predisposition to SCC, or harbor mutations affecting CASP8, RAS-MAPK pathways, chromatin modifiers, and immunoregulatory molecules. We uncovered hypomethylation of the alternative promoter that drives expression of the ΔNp63 oncogene and embedded miR944. Co-expression of immune checkpoint, T-regulatory, and Myeloid suppressor cells signatures may explain reduced efficacy of immune therapy. These findings support possibilities for molecular classification and therapeutic approaches.

Keywords: bladder carcinoma with squamous differentiation; cervical squamous cell carcinoma; esophageal squamous cell carcinoma; genomics; head and neck squamous cell carcinoma; human papillomavirus; lung squamous cell carcinoma; proteomics; transcriptomics.


Conflict of interest statement

DECLARATION OF INTERESTS

Michael Seiler, Peter G. Smith, Ping Zhu, Silvia Buonamici, and Lihua Yu are employees of H3 Biomedicine, Inc. Parts of this work are the subject of a patent application, WO2017040526 titled “Splice variants associated with neomorphic sf3b1 mutants.” Shouyoung Peng, Anant A. Agrawal, James Palacino, and Teng are employees of H3 Biomedicine, Inc. Andrew D. Cherniack, Ashton C. Berger, and Galen F. Gao receive research support from Bayer Pharmaceuticals. Gordon B. Mills serves on the External Scientific Review Board of Astrazeneca. Anil Sood is on the Scientific Advisory Board for Kiyatec and is a shareholder in BioPath. Jonathan S. Serody receives funding from Merck, Inc. Kyle R. Covington is an employee of Castle Biosciences, Inc. Preethi H. Gunaratne is founder, CSO, and shareholder of NextmiRNA Therapeutics. Christina Yau is a part-time employee/consultant at NantOmics. Franz X. Schaub is an employee and shareholder of SEngine Precision Medicine, Inc. Carla Grandori is an employee, founder, and shareholder of SEngine Precision Medicine, Inc. Robert N. Eisenman is a member of the Scientific Advisory Boards and shareholder of Shenogen Pharma and Kronos Bio. Daniel J. Weisenberger is a consultant for Zymo Research Corporation. Joshua M. Stuart is the founder of Five3 Genomics and shareholder of NantOmics. Marc T. Goodman receives research support from Merck, Inc. Andrew J. Gentles is a consultant for Cibermed. Charles M. Perou is an equity stock holder, consultant, and Board of Directors member of BioClassifier and GeneCentric Diagnostics and is also listed as an inventor on patent applications on the Breast PAM50 and Lung Cancer Subtyping assays. Matthew Meyerson receives research support from Bayer Pharmaceuticals; is an equity holder in, consultant for, and Scientific Advisory Board chair for OrigiMed; and is an inventor of a patent for EGFR mutation diagnosis in lung cancer, licensed to LabCorp. Eduard Porta-Pardo is an inventor of a patent for domainXplorer. Han Liang is a shareholder and scientific advisor of Precision Scientific and Eagle Nebula. Da Yang is an inventor on a pending patent application describing the use of antisense oligonucleotides against specific lncRNA sequence as diagnostic and therapeutic tools. Yonghong Xiao was an employee and shareholder of TESARO, Inc. Bin Feng is an employee and shareholder of TESARO, Inc. Carter Van Waes received research funding for the study of IAP inhibitor ASTX660 through a Cooperative Agreement among NIDCD, NIH, and Astex Pharmaceuticals. Raunaq Malhotra is an employee and shareholder of Seven Bridges, Inc. Peter W. Laird serves on the Scientific Advisory Board for AnchorDx. Joel Tepper is a consultant at EMD Serono. Kenneth Wang serves on the Advisory Board for Boston Scientific, Microtech, and Olympus. Andrea Califano is a founder, shareholder, and advisory board member of DarwinHealth, Inc. and a shareholder and advisory board member of Tempus, Inc. Toni K. Choueiri serves as needed on advisory boards for Bristol-Myers Squibb, Merck, and Roche. Lawrence Kwong receives research support from Array BioPharma. Sharon E. Plon is a member of the Scientific Advisory Board for Baylor Genetics Laboratory. Beth Y. Karlan serves on the Advisory Board of Invitae.

Figures
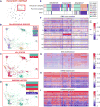
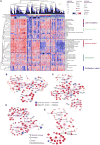
Figure 1
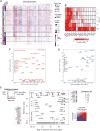
Figure 1. TumorMap and iCluster of Squamous Cancers from PanCancer-33 Analysis
(A) TumorMap analysis visualizing close mapping of LUSC, HNSC, ESCA, CESC, and BLCA among 28 PanCancer-33 islands. (B) Higher resolution view of TM islands and distribution of SCC from 5 sites. (C) HPV status showing the majority of HPV(+) CESC and HNSC map around a distinct island. (D) Smoking history of SCC. Each spot in the map represents a sample. The colors of the sample spots represent attributes as described for each panel. (E–I) Summary of iCluster analysis (E), DNA copy-number (F), methylation (G), mRNA (H), and miRNA (I) expression. PanCancer-33 SCC and other tumors and Pan-SCC from 5 sites identified by histopathologic diagnosis cluster within iC10, iC25, and iC27. Annotation bars show cancer type and HPV status, and keys show an increase (red) or decrease (blue) in features as indicated: DNA copy number, copy-number log ratio (tumor versus normal); DNA methylation, normalized beta values; miRNA expression, normalized log expression counts; miRNA expression, normalized log expression counts.
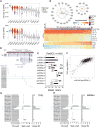
Figure 2
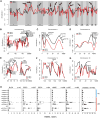
Figure 2. Correlation between DNA Copy Number of Chromosomal Regions and Expression of Multiple Genes, and Predominant Expression of ΔNp63 Isoforms of TP63 Gene for 5 Pan-SCC Tumor Sites
The MVisAGe R-package was used to compute and plot gene-level Pearson correlation coefficients (ρ values) based on quantitative measurements of DNA copy number (CN) and log2(RSEM + 1) gene expression measurements for Pan-SCC data. (A) Smoothed ρ values plotted for all chromosomes, with arrows highlighting regions of peak correlation between CN and expression for HPV(−) (black) and (+) (red) SCC. (B–G) Smoothed ρ values and selected genes with individual unsmoothed ρ > 0.6 plotted based on genomic positions in selected regions of chr3q (B), 5p (C), 8p (D), 11q13/q22 (E), 14q (F), and 19 (G). (H) TP63 isoform mRNA abundance (RSEM) for full transactivating (TA) domain or alternatively transcribed N-terminally truncated (ΔN) isoforms in Pan-SCC tumors. ΔNp63α (uc003fsc.2) and other ΔN isoforms are preferentially expressed compared to TA isoforms. Boxplots show median values and the 25th to 75th percentile range in the data, i.e. the interquartile range (IQR). Whisker bars extend 1.5 times the IQR.
Figure 3
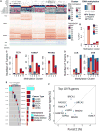
Figure 3. Common, Unique, and Heterogeneous Genomic Alterations in Squamous Cell Carcinomas
(A) Unsupervised clustering of CNAs in 1,386 squamous cell carcinomas revealed five distinct clusters, with higher recurrent amplifications or deletions or with few focal alterations. Color bars at the left indicate the 5 tumor types (HNSCs, LUSCs, ESCAs, CESCs, and BLCAs), HPV status, and CNA cluster. Red indicates copy gain, blue indicates copy loss, and white indicates copy-number neutrality. (B) 63 genes were significantly mutated in one or more of 5 tumors in the Pan-SCC cohort (MutSig2CV analysis; FDR q-value < 0.1), and the mutation frequencies of 17 of the genes that were correlated with CNA cluster are indicated. (C and D) The q-values for (C) recurrent amplifications and (D) deletions in the Pan-SCC cohort (y axis) are plotted against q-values for the same gene in the cohort of 27 non-SCC tumor types (x axis). Genes in the top left and bottom right quadrants are significantly altered exclusively in the Pan-SCC and non-SCC cohorts, respectively; genes in the top right are significantly altered in both. (E) The best q-value for each significantly mutated gene across all SCC types (x axis) is plotted against the best q-value for the same gene in the 27 other tumor types (y axis). Point size is proportional to the frequency of mutations in the gene in the Pan-SCC cohort. Point color indicates enrichment for mutation clustering defined by MutSig2CV (–log10 pCL) and/or enrichment for gain- or loss-of-function mutations (–log10 p value; Fisher’s exact test) in the Pan-SCC cohort. Black circles in the lower quadrant indicate genes more significant in another cancer type, compared to SCC tumor types.
Figure 4
Figure 4. DNA Methylation Consensus Clusters with Distinct Mutation and HPV Profiles, and Unique DNA Damage and Repair Genes in Squamous Cell Carcinomas
(A) MethylMix identified 905 abnormally methylated genes inversely associated mRNA expression, and that formed five DNA methylation consensus clusters presented in the heatmap. Top bars indicate DNA methylation clusters, cancer types, HPV status, mutations in genes, and other platform clusters that are significantly differentially distributed between DNA methylation clusters. Brown, hypermethylation; blue, hypomethylation. (B) Variability in the percentage of patients within each DNA methylation cluster that are HPV positive. Bar colors indicate the portion of different cancer types among HPV-positive patients within each methylation cluster. (C and D) Genes that are hypermethylated (C) or hypomethylated (D) and anti-correlated with mRNA expression in SCC, and annotated in COSMIC. The number and portion of tumors from 5 SCC sites displaying abnormal methylation and expression within each DNA methylation cluster are shown on the Y axes. (E) Dysregulations of Fanconi Anemia (FA) and DNA repair pathways across squamous cell carcinomas. Oncoprint representation of frequency of mutation, deep deletion, and methylation for FA and DNA damage response pathway genes. (F) The percentage of cancer samples with altered FA and DNA damage response genes in the Pan-SCC cohort (x axis) are plotted against for the same genes in the PanCan-33 tumor cohort (y axis). FANCF in the right lower region is significantly altered more frequently in the Pan-SCC cohort (2-sample test for equality of proportions, chi-square = 84.5, p < 2.2E–16).
Figure 5
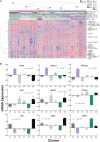
Figure 5. mRNA Expression Subtypes in Squamous Cell Carcinomas
(A) Consensus unsupervised clustering analysis of 1,867 functionally defined cancer genes resulted in the identification of six gene expression-based clusters/subtypes from the five types of squamous cell carcinomas, visualized via clustered heatmap. The cancer types, HPV status, and clusters are indicated by the annotation bars on the top. Differentially clustered oncogenes, tumor suppressor, and immune gene signatures are highlighted on the right side. (B) The relative mRNA expression levels of genes significantly differentially expressed across Pan-SCC mRNA subtypes. Mean mRNA expression with bars representing 95% confidence intervals are shown.
Figure 6
Figure 6. PARADIGM Analysis Revealed Specific Signatures Enriched in Squamous Cell Carcinomas
(A) Consensus clustering of SCC based on top varying PARADIGM inferred pathway levels (IPLs). The heatmap shows scaled PARADIGM IPLs of key regulatory nodes with >15 downstream targets also showing differential inferred activation. Column color annotation shows consensus cluster membership, tumor type, PanCancer-33 cluster membership, and HPV status. Row color annotation on the right side highlights groups of regulatory nodes potentially implicating the same pathway categories or biological processes. (B–E) Cytoscape plot of pathway features with differential PARADIGM IPLs connected by regulatory interactions through nodes with >15 differential downstream targets. Subnetwork neighborhoods centered around (B) ERK/MAPK1/JUN/FOS, (C) RELA/p50 and STAT Immune related, (D) p63/DNA damage, and (E) proliferation/mitosis. IPL level (red, higher in SCC; blue, lower in SCC) and node shape reflect feature type (circle, genes; diamond, complexes; V, abstract processes; square, protein family or miRNA). Edge color and type represent interaction type (activating, purple arrow; green T, inhibitory). Proteins and selected complexes are labeled, and regulatory nodes with >15 downstream targets are highlighted in bold.
Figure 7
Figure 7. miRNAs Associated with EMT and Hypomethylation and Expression of ΔNp63 Isoforms of TP63 in SCC
(A) Abundance of the most differentially expressed miRNAs miR-205-5p and miR-944 with the highest median expression across the TCGA cancer types (Figure S7). Dots represent Pan-SCC tumors (red), non-squamous TCGA tumors (gray), and normal tissues (blue). Boxplots show median values and the 25th to 75th percentile range in the data, i.e. the interquartile range (IQR). Whisker bars extend 1.5 times the IQR. (B) Potential gene targets that are significantly anti-correlated to miR-205-5p and miR-944 (Spearman < −0.2, FDR < 0.05) and that have functional validation evidence for direct targeting in miRTarBase v.6.0. Solid versus dotted lines indicate strong versus weaker functional evidence. Numbers on network edges show Spearman correlations between a miRNA and gene. (C) Heatmap of log10 abundance of miRNAs associated with EMT mRNAs across squamous tumors (n = 1,381). Samples are ordered by the sum of the Z scores across the EMT-associated miRNAs. (D) Top, Genome view of TAp63, ΔNp63 isoforms, and MIR-944, with PROmiRNA experimentally supported transcriptional start sites (TSSs) for MIR944 (Marsico et al., 2013) that overlap the TSS of alternatively transcribed ΔNp63 isoforms. Bottom, Illumina 450k probes for CpG sites in region of TP63 corresponding to TSSs and coding portion of TAp63, ΔNp63, and MIR944 (blue box). (E) TP63 isoform mRNA abundance (RSEM) for full transactivating (TA) domain or alternatively transcribed N-terminally truncated (ΔN) isoforms in Pan-SCC tumors (n = 1,403). The ΔN/TAp63 median ratio difference is 212.8-fold. Boxplots show median values and the 25th to 75th percentile range in the data, i.e. the interquartile range (IQR). Whisker bars extend 1.5 times the IQR. (F) Across Pan-SCC data, miR-944 has largest positive Spearman correlation coefficient for expressed TP63 isoforms. (G and H) Comparison of coefficients of correlation for copy number (CN), methylation (Meth), and rho-squared (R2) for Illumina 450k probes for CpG sites from (D), with expression of TP63 (G), and MIR944 (H). The blue box corresponds to probes at TSS for ΔNp63 and the TSS for MIR944, which show relatively lower CN and negative Meth coefficients, that most highly correlate with expression of TP63 (for cg06520450 R2 = 0.36, p = 7.4E–106) and MIR944 (cg06520450 R2 = 0.39, p = 1.2E–112).

References

    1. Aarts M, Bajrami I, Herrera-Abreu MT, Elliott R, Brough R, Ashworth A, Lord CJ, Turner NC. Functional Genetic Screen Identifies Increased Sensitivity to WEE1 Inhibition in Cells with Defects in Fanconi Anemia and HR Pathways. Mol Cancer Ther. 2015;14:865–876. - PMC - PubMed
    1. Alter BP, Giri N, Savage SA, Quint WG, de Koning MN, Schiffman M. Squamous cell carcinomas in patients with Fanconi anemia and dyskeratosis congenita: a search for human papillomavirus. Int J Cancer. 2013;133:1513–1515. - PMC - PubMed
    1. Banerjee R, Russo N, Liu M, Basrur V, Bellile E, Palanisamy N, Scanlon CS, van Tubergen E, Inglehart RC, Metwally T, et al. TRIP13 promotes error-prone nonhomologous end joining and induces chemoresistance in head and neck cancer. Nat Commun. 2014;5:4527. - PMC - PubMed
    1. Barbieri CE, Barton CE, Pietenpol JA. Delta Np63 alpha expression is regulated by the phosphoinositide 3-kinase pathway. J Biol Chem. 2003;278:51408–51414. - PubMed
    1. Broom BM, Ryan MC, Brown RE, Ikeda F, Stucky M, Kane DW, Melott J, Wakefield C, Casasent TD, Akbani R, Weinstein JN. A Galaxy Implementation of Next-Generation Clustered Heatmaps for Interactive Exploration of Molecular Profiling Data. Cancer Res. 2017;77:e23–e26. - PMC - PubMed

Publication types

MeSH terms

Grants and funding