

Driver Fusions and Their Implications in the Development and Treatment of Human Cancers
- PMID: 29617662
- PMCID: PMC5916809
- DOI: 10.1016/j.celrep.2018.03.050
Driver Fusions and Their Implications in the Development and Treatment of Human Cancers
Abstract
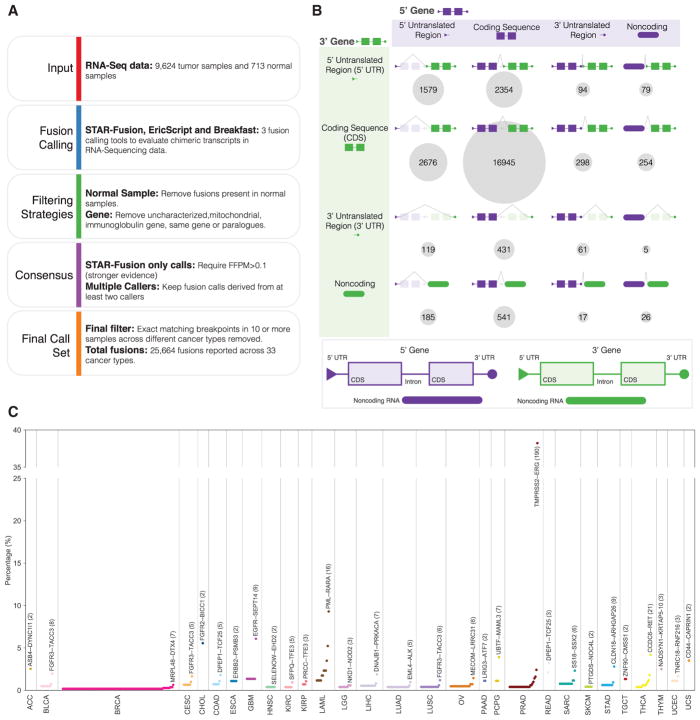
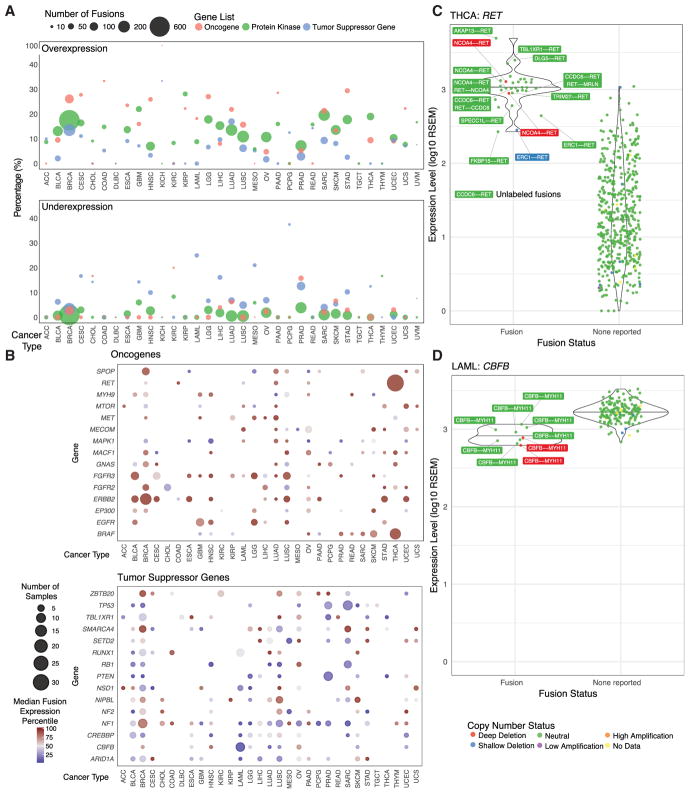
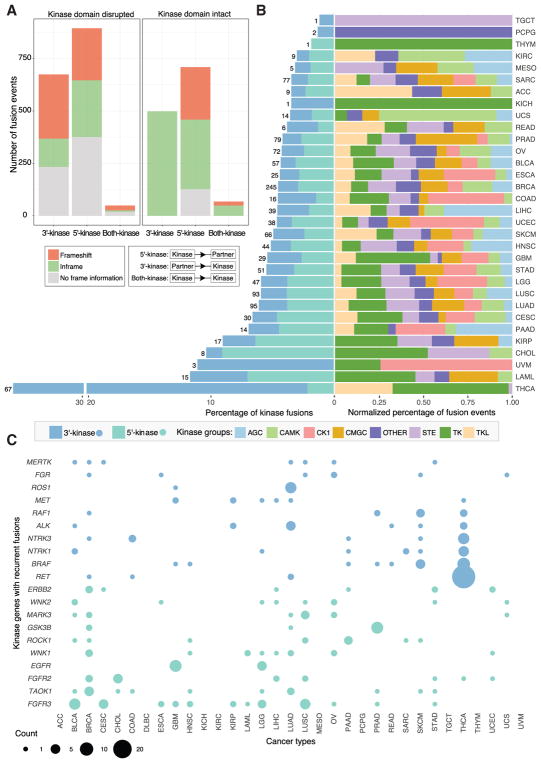
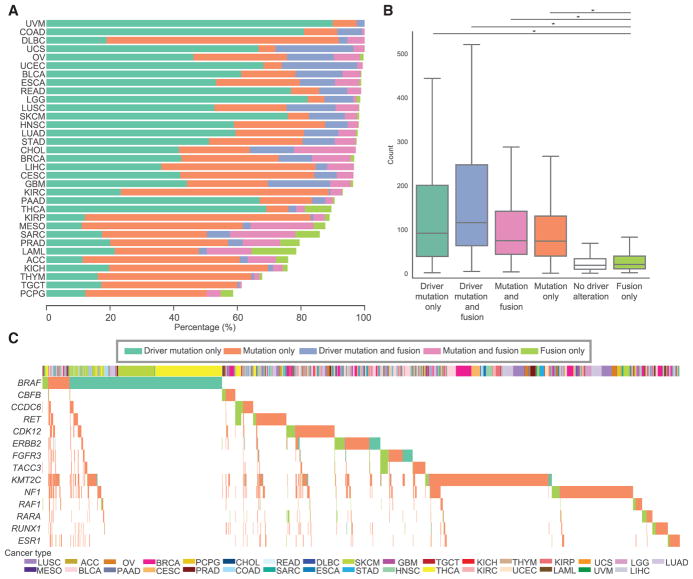
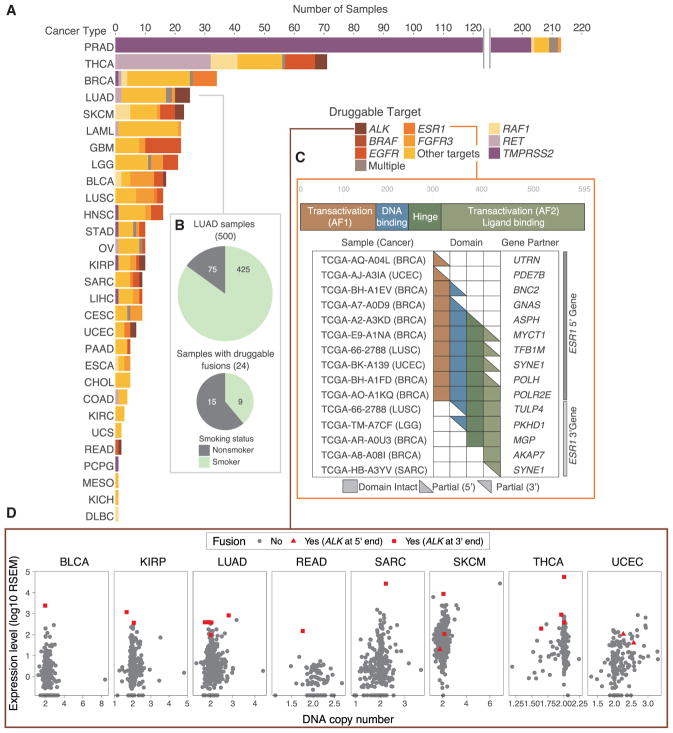
Gene fusions represent an important class of somatic alterations in cancer. We systematically investigated fusions in 9,624 tumors across 33 cancer types using multiple fusion calling tools. We identified a total of 25,664 fusions, with a 63% validation rate. Integration of gene expression, copy number, and fusion annotation data revealed that fusions involving oncogenes tend to exhibit increased expression, whereas fusions involving tumor suppressors have the opposite effect. For fusions involving kinases, we found 1,275 with an intact kinase domain, the proportion of which varied significantly across cancer types. Our study suggests that fusions drive the development of 16.5% of cancer cases and function as the sole driver in more than 1% of them. Finally, we identified druggable fusions involving genes such as TMPRSS2, RET, FGFR3, ALK, and ESR1 in 6.0% of cases, and we predicted immunogenic peptides, suggesting that fusions may provide leads for targeted drug and immune therapy.
Keywords: RNA; cancer; fusion; gene fusions; translocation.
Copyright © 2018 The Authors. Published by Elsevier Inc. All rights reserved.
Conflict of interest statement
Michael Seiler, Peter G. Smith, Ping Zhu, Silvia Buonamici, and Lihua Yu are employees of H3 Biomedicine, Inc. Parts of this work are the subject of a patent application: WO2017040526 titled “Splice variants associated with neomorphic sf3b1 mutants.” Shouyoung Peng, Anant A. Agrawal, James Palacino, and Teng Teng are employees of H3 Biomedicine, Inc. Andrew D. Cherniack, Ashton C. Berger, and Galen F. Gao receive research support from Bayer Pharmaceuticals. Gordon B. Mills serves on the External Scientific Review Board of Astrazeneca. Anil Sood is on the Scientific Advisory Board for Kiyatec and is a shareholder in BioPath. Jonathan S. Serody receives funding from Merck, Inc. Kyle R. Covington is an employee of Castle Biosciences, Inc. Preethi H. Gunaratne is founder, CSO, and shareholder of NextmiRNA Therapeutics. Christina Yau is a part-time employee/consultant at NantOmics. Franz X. Schaub is an employee and shareholder of SEngine Precision Medicine, Inc. Carla Grandori is an employee, founder, and shareholder of SEngine Precision Medicine, Inc. Robert N. Eisenman is a member of the Scientific Advisory Boards and shareholder of Shenogen Pharma and Kronos Bio. Daniel J. Weisenberger is a consultant for Zymo Research Corporation. Joshua M. Stuart is the founder of Five3 Genomics and shareholder of NantOmics. Marc T. Goodman receives research support from Merck, Inc. Andrew J. Gentles is a consultant for Cibermed. Charles M. Perou is an equity stock holder, consultant, and Board of Directors member of BioClassifier and GeneCentric Diagnostics and is also listed as an inventor on patent applications on the Breast PAM50 and Lung Cancer Subtyping assays. Matthew Meyerson receives research support from Bayer Pharmaceuticals; is an equity holder in, consultant for, and Scientific Advisory Board chair for OrigiMed; and is an inventor of a patent for EGFR mutation diagnosis in lung cancer, licensed to LabCorp. Eduard Porta-Pardo is an inventor of a patent for domainXplorer. Han Liang is a shareholder and scientific advisor of Precision Scientific and Eagle Nebula. Da Yang is an inventor on a pending patent application describing the use of antisense oligonucleotides against specific lncRNA sequence as diagnostic and therapeutic tools. Yonghong Xiao was an employee and shareholder of TESARO, Inc. Bin Feng is an employee and shareholder of TESARO, Inc. Carter Van Waes received research funding for the study of IAP inhibitor ASTX660 through a Cooperative Agreement between NIDCD, NIH, and Astex Pharmaceuticals. Raunaq Malhotra is an employee and shareholder of Seven Bridges, Inc. Peter W. Laird serves on the Scientific Advisory Board for AnchorDx. Joel Tepper is a consultant at EMD Serono. Kenneth Wang serves on the Advisory Board for Boston Scientific, Microtech, and Olympus. Andrea Califano is a founder, shareholder, and advisory board member of DarwinHealth, Inc. and a shareholder and advisory board member of Tempus, Inc. Toni K. Choueiri serves as needed on advisory boards for Bristol-Myers Squibb, Merck, and Roche. Lawrence Kwong receives research support from Array BioPharma. Sharon E. Plon is a member of the Scientific Advisory Board for Baylor Genetics Laboratory. Beth Y. Karlan serves on the Advisory Board of Invitae.
Figures
References
-
- Bailey MH, Tokheim C, Porta-Pardo E, Sengupta S, Bertrand D, Weerasinghe A, Colaprico A, Wendl MC, Kim J, Reardon B, et al. Comprehensive Characterization of Cancer Driver Genes and Mutations. Cell. 2018;173 https://doi.org/10.1016/j.cell.2018.02.060. - DOI - PMC - PubMed
-
- Benelli M, Pescucci C, Marseglia G, Severgnini M, Torricelli F, Magi A. Discovering chimeric transcripts in paired-end RNA-seq data by using EricScript. Bioinformatics. 2012;28:3232–3239. - PubMed
Publication types
MeSH terms
Substances
Grants and funding
- P30 CA016672/CA/NCI NIH HHS/United States
- U24 CA143882/CA/NCI NIH HHS/United States
- U54 HG003067/HG/NHGRI NIH HHS/United States
- U24 CA143835/CA/NCI NIH HHS/United States
- U24 CA143866/CA/NCI NIH HHS/United States
- U24 CA210950/CA/NCI NIH HHS/United States
- U24 CA143845/CA/NCI NIH HHS/United States
- U24 CA143799/CA/NCI NIH HHS/United States
- U54 HG003273/HG/NHGRI NIH HHS/United States
- U24 CA144025/CA/NCI NIH HHS/United States
- U24 CA143840/CA/NCI NIH HHS/United States
- U24 CA143843/CA/NCI NIH HHS/United States
- R01 CA180006/CA/NCI NIH HHS/United States
- U24 CA143858/CA/NCI NIH HHS/United States
- U24 CA143848/CA/NCI NIH HHS/United States
- U24 CA210957/CA/NCI NIH HHS/United States
- U54 HG003079/HG/NHGRI NIH HHS/United States
- U24 CA210949/CA/NCI NIH HHS/United States
- U24 CA143883/CA/NCI NIH HHS/United States
- U24 CA211006/CA/NCI NIH HHS/United States
- R01 CA163722/CA/NCI NIH HHS/United States
- R01 CA178383/CA/NCI NIH HHS/United States
- U24 CA143867/CA/NCI NIH HHS/United States
- R50 CA221675/CA/NCI NIH HHS/United States
- U24 CA210990/CA/NCI NIH HHS/United States
LinkOut - more resources
Full Text Sources
Other Literature Sources
Miscellaneous
