. 2018 Apr 3;23(1):255-269.e4.
doi: 10.1016/j.celrep.2018.03.077.

Molecular Characterization and Clinical Relevance of Metabolic Expression Subtypes in Human Cancers

Collaborators, Affiliations

Molecular Characterization and Clinical Relevance of Metabolic Expression Subtypes in Human Cancers

Xinxin Peng et al. Cell Rep. .

Abstract

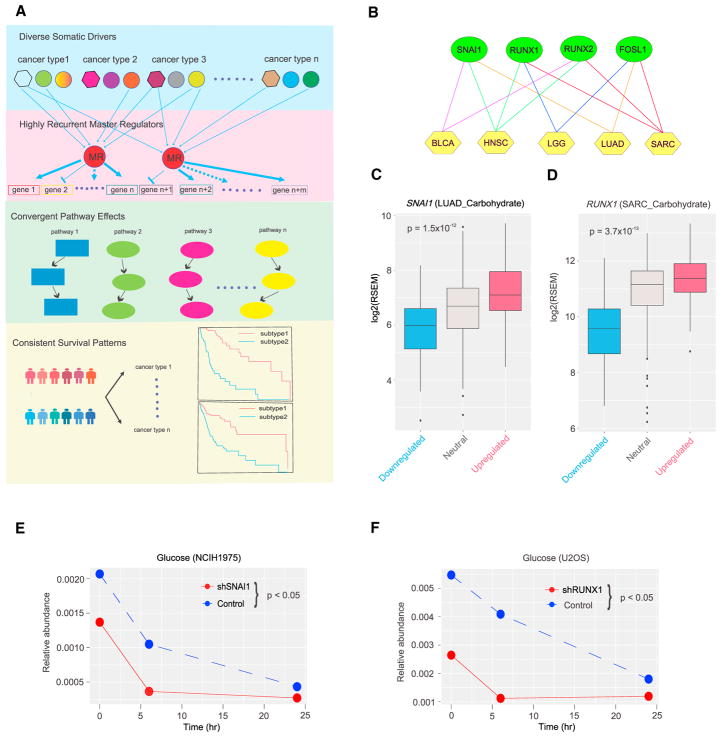
Metabolic reprogramming provides critical information for clinical oncology. Using molecular data of 9,125 patient samples from The Cancer Genome Atlas, we identified tumor subtypes in 33 cancer types based on mRNA expression patterns of seven major metabolic processes and assessed their clinical relevance. Our metabolic expression subtypes correlated extensively with clinical outcome: subtypes with upregulated carbohydrate, nucleotide, and vitamin/cofactor metabolism most consistently correlated with worse prognosis, whereas subtypes with upregulated lipid metabolism showed the opposite. Metabolic subtypes correlated with diverse somatic drivers but exhibited effects convergent on cancer hallmark pathways and were modulated by highly recurrent master regulators across cancer types. As a proof-of-concept example, we demonstrated that knockdown of SNAI1 or RUNX1-master regulators of carbohydrate metabolic subtypes-modulates metabolic activity and drug sensitivity. Our study provides a system-level view of metabolic heterogeneity within and across cancer types and identifies pathway cross-talk, suggesting related prognostic, therapeutic, and predictive utility.

Keywords: The Cancer Genome Atlas; carbohydrate metabolism; drug sensitivity; master regulator; prognostic markers; somatic drivers; therapeutic targets; tumor subtypes.


Conflict of interest statement

DECLARATION OF INTERESTS

Michael Seiler, Peter G. Smith, Ping Zhu, Silvia Buonamici, and Lihua Yu are employees of H3 Biomedicine, Inc. Parts of this work are the subject of a patent application: WO2017040526 titled “Splice variants associated with neomorphic sf3b1 mutants.” Shouyoung Peng, Anant A. Agrawal, James Palacino, and Teng Teng are employees of H3 Biomedicine, Inc. Andrew D. Cherniack, Ashton C. Berger, and Galen F. Gao receive research support from Bayer Pharmaceuticals. Gordon B. Mills serves on the External Scientific Review Board of Astrazeneca. Anil Sood is on the Scientific Advisory Board for Kiyatec and is a shareholder in BioPath. Jonathan S. Serody receives funding from Merck, Inc. Kyle R. Covington is an employee of Castle Biosciences, Inc. Preethi H. Gunaratne is founder, CSO, and shareholder of NextmiRNA Therapeutics. Christina Yau is a part-time employee/consultant at NantOmics. Franz X. Schaub is an employee and shareholder of SEngine Precision Medicine, Inc. Carla Grandori is an employee, founder, and shareholder of SEngine Precision Medicine, Inc. Robert N. Eisenman is a member of the Scientific Advisory Boards and shareholder of Shenogen Pharma and Kronos Bio. Daniel J. Weisenberger is a consultant for Zymo Research Corporation. Joshua M. Stuart is the founder of Five3 Genomics and shareholder of NantOmics. Marc T. Goodman receives research support from Merck, Inc. Andrew J. Gentles is a consultant for Cibermed. Charles M. Perou is an equity stock holder, consultant, and Board of Directors member of BioClassifier and GeneCentric Diagnostics and is also listed as an inventor on patent applications on the Breast PAM50 and Lung Cancer Subtyping assays. Matthew Meyerson receives research support from Bayer Pharmaceuticals; is an equity holder in, consultant for, and Scientific Advisory Board chair for OrigiMed; and is an inventor of a patent for EGFR mutation diagnosis in lung cancer, licensed to LabCorp. Eduard Porta-Pardo is an inventor of a patent for domainXplorer. Han Liang is a shareholder and scientific advisor of Precision Scientific and Eagle Nebula. Da Yang is an inventor on a pending patent application describing the use of antisense oligonucleotides against specific lncRNA sequence as diagnostic and therapeutic tools. Yonghong Xiao was an employee and shareholder of TESARO, Inc. Bin Feng is an employee and shareholder of TESARO, Inc. Carter Van Waes received research funding for the study of IAP inhibitor ASTX660 through a Cooperative Agreement between NIDCD, NIH, and Astex Pharmaceuticals. Raunaq Malhotra is an employee and shareholder of Seven Bridges, Inc. Peter W. Laird serves on the Scientific Advisory Board for AnchorDx. Joel Tepper is a consultant at EMD Serono. Kenneth Wang serves on the Advisory Board for Boston Scientific, Microtech, and Olympus. Andrea Califano is a founder, shareholder, and advisory board member of DarwinHealth, Inc. and a shareholder and advisory board member of Tempus, Inc. Toni K. Choueiri serves as needed on advisory boards for Bristol-Myers Squibb, Merck, and Roche. Lawrence Kwong receives research support from Array BioPharma. Sharon E. Plon is a member of the Scientific Advisory Board for Baylor Genetics Laboratory. Beth Y. Karlan serves on the Advisory Board of Invitae.

Figures

Figure 1
Figure 1. The Expression Patterns of Metabolic Pathway Genes Reflect Metabolite Levels in Cancer Patient Samples
(A) The analytic pipeline for assessing whether the expression levels of metabolic pathway genes are correlated with the concentration of a given metabolite. (B) Representative quantile-quantile (QQ) plots showing p values (log transformed) from the metabolite-gene Spearman correlation coefficients of pathway genes compared to other genes. Sarcosine for amino acid metabolism; N-acetylmannosamine for carbohydrate metabolism; 5, 6-dihydrouracil for nucleotide metabolism; nicotinamide adenine dinucleotide for vitamin & cofactor metabolism. (C) Heatmap showing all metabolites whose intracellular concentrations significantly correlate with the expression levels of the corresponding pathway genes (FDR < 0.15). (D) The statistical significance of the numbers of metabolites correlated with the pathway gene expression based on the background distribution of random gene sets. The red lines indicate the true numbers.
Figure 2
Figure 2. Classification of Metabolic Expression Subtypes Based on Pathway Gene Expression
(A) The computational method to classify tumor samples into three metabolic expression subtypes: upregulated, downregulated, and neutral. Bar charts represent the numbers of genes for metabolic pathways surveyed. (B) Distributions of three metabolic subtypes for each metabolic pathway in 33 cancer types. Only tumor subtype classifications passing the two-step statistical criteria in (A) are shown. (C) Frequency distribution of a specific metabolic subtype combination. The red line is for the observed distribution; black lines are for the random expectation assuming that each metabolic pathway is perturbed independently in a tumor sample. (D) The top 10 most frequently observed metabolic subtype combinations. Red, upregulated subtype; gray, neutral subtype; and blue, downregulated subtype. The right panel indicates the observed and expected frequencies of a specific subtype combination. Data are represented as mean ± SD. *p < 0.05, ***p < 0.001. (E) Clustering pattern of the seven metabolic subtypes based on the similarity of subtype labels across 9,125 samples. See also Table S1, Table S2, and Figure S1.
Figure 3
Figure 3. Associations of Metabolic Expression Subtypes with Patient Survival Times and Tumor Subtypes
(A) Clinical associations of metabolic expression subtypes with patient overall survival times. Color indicates the correlation direction; significant correlations (log-rank test, FDR < 0.2) are boxed. Those cases without qualified subtype classifications are left in blank. (B) Kaplan-Meier plots for carbohydrate metabolic expression subtypes associated with patient overall survival times in head and neck squamous cell carcinoma (HNSC), low-grade glioma (LGG), lung adenocarcinoma (LUAD), and sarcoma (SARC). (C) Kaplan-Meier plots for lipid metabolic expression subtypes associated with patient overall survival times in adrenocortical carcinoma (ACC), colon adenocarcinoma (COAD), kidney renal clear cell carcinoma (KIRC), and liver hepatocellular carcinoma (LIHC). Cancer type, metabolic expression subtype, and the p value of log-rank test are shown at the top of each plot. (D) Representative examples of associations between metabolic expression subtypes and established tumor subtypes. p values are based on chi-square test. See also Figures S2–S4.
Figure 4
Figure 4. Somatic Drivers and Biological Pathways Associated with Metabolic Expression Subtypes
(A) Somatic mutation drivers associated with metabolic expression subtypes. For each cancer type, the mutational status of significantly mutated genes (identified by MutSigCV, with a mutation frequency > 5%) were assessed based on chi-square test. Colors in each circle indicate the correlations with different kinds of metabolic expression subtypes. (B) Correlations of metabolic expression subtypes with TP53 mutation status. The inner band indicates the mutation status of TP53 (dark red, mutated; light red, wide-type); external bands indicate the subtype information of a specific metabolic pathway (red, upregulated; gray, neutral; and blue, downregulated). (C) Somatic copy number alteration drivers associated with metabolic expression subtypes. For each cancer type, the copy number status of known oncogenes or tumor suppressors residing in a significant amplification for deletion peak (identified by GISTIC2) were assessed based on chi-square test. (D) Correlations of metabolic expression subtypes with MYC amplification status. The inner band indicates the amplification status of MYC (dark red, high-level amplification; light red, low-level amplification); external bands indicate the subtype information of a specific metabolic pathway (red, upregulated; gray, neutral; and blue, downregulated). In (A) and (C), only associations with FDR < 0.05 are shown; color indicates the specific associated metabolic pathway. (E) Correlations of metabolic expression subtypes with six cancer hallmarks and mTOR signaling pathway based on GSEA (the related gene sets are based on MSigDB). Those cases without qualified subtype classifications are left in blank, and significant enrichments (FDR < 0.01) are colored in red or blue. For the analysis, differentially expressed genes were identified between the upregulated and downregulated subtypes. Red indicates the enrichment of a hallmark gene set in genes highly expressed in the upregulated metabolic expression subtype; blue indicates the opposite pattern.
Figure 5
Figure 5. Master Regulators Associated with Metabolic Expression Subtypes
(A) Overview of computational algorithms used to identify master transcription factors. (B) Network view of “master” transcription factors associated with metabolic expression subtype. The line thickness indicates the number of cancer types where the connection was identified. Only the connections identified in ≥3 cancer types are shown. (C) Network view of “master” miRNA regulators. (D) MiRNA hsa-miR-320a identified as a master regulator for expression subtypes of the nucleotide metabolism pathway in stomach adenocarcinoma (STAD). SCNAs of hsa-miR-320a lead to a lower expression in the samples of downregulated subtype. Its target genes are significantly enriched in genes highly expressed in the downregulated subtype. The middle line in the box is the median, and the bottom and top of the box are the first and third quartiles, and the whiskers extend to 1.5× interquartile range of the lower quartile and the upper quartile, respectively.
Figure 6
Figure 6. Effects of Master Regulators on Carbohydrate Metabolism
(A) Systematic view of metabolic reprogramming across cancer types. (B) The network shows that master TFs for carbohydrate metabolism identified in ≥3 cancer types whose upregulated subtypes showed significant worse prognosis, and these master regulators have ≥150 target genes and higher expression levels in the upregulated subtypes. (C and D) Master regulator expression level in three carbohydrate metabolic expression subtypes: SNAI1 in lung adenocarcinoma (LUAD) (C) and RUNX1 in sarcoma (SARC) (D). The middle line in the box is the median, and the bottom and top of the box are the first and third quartiles, and the whiskers extend to 1.5× interquartile range of the lower quartile and the upper quartile, respectively. (E and F) Relative abundance of intracellular glucose in the NCIH1975 cell line (control) and the cell line with shRNA-mediated SNAI1 knockdown (E) and in the U2OS cell line (control) and the cell line with shRNA-mediated RUNX1 knockdown (F) at three time points (0 hr, 6 hr, and 24 hr). p value was based on paired t test. See also Figure S5 and Table S3.
Figure 7
Figure 7. Carbohydrate Expression Subtypes Are Informative about Drug Sensitivity
(A) Heatmap showing drug sensitivity variation across lung cancer cell lines. Those lung cancer cell lines were classified into downregulated, neutral, and upregulated carbohydrate metabolic subtypes using the same method as for TCGA patient samples. All the drugs with a significant difference of IC50 (log-transformed) among the three subtypes (FDR < 0.05) are shown. (B) The distributions showing the log-transformed IC50 values of docetaxel in the carbohydrate metabolic expression subtypes. (C and D) The effect of SNAI1 knockdown in NCIH1975 cells on drug response of docetaxel at 16 hr (C) and 24 hr (D). Data are represented as mean ± SE. Compared to negative control (scrambled shRNA), *p < 0.05. See also Figure S6.

References

    1. Aytes A, Mitrofanova A, Lefebvre C, Alvarez MJ, Castillo-Martin M, Zheng T, Eastham JA, Gopalan A, Pienta KJ, Shen MM, et al. Cross-species regulatory network analysis identifies a synergistic interaction between FOXM1 and CENPF that drives prostate cancer malignancy. Cancer Cell. 2014;25:638–651. - PMC - PubMed
    1. Barretina J, Caponigro G, Stransky N, Venkatesan K, Margolin AA, Kim S, Wilson CJ, Lehár J, Kryukov GV, Sonkin D, et al. The Cancer Cell Line Encyclopedia enables predictive modelling of anticancer drug sensitivity. Nature. 2012;483:603–607. - PMC - PubMed
    1. Cancer Genome Atlas Research Network; Analysis Working Group: Asan University; BC Cancer Agency; Brigham and Women’s Hospital; Broad Institute; Brown University; Case Western Reserve University; Dana-Farber Cancer Institute; Duke University; et al. Integrated genomic characterization of oesophageal carcinoma. Nature. 2017;541:169–175. - PMC - PubMed
    1. Chan B, Manley J, Lee J, Singh SR. The emerging roles of microRNAs in cancer metabolism. Cancer Lett. 2015;356(2 Pt A):301–308. - PubMed
    1. Claus EB, Walsh KM, Wiencke JK, Molinaro AM, Wiemels JL, Schildkraut JM, Bondy ML, Berger M, Jenkins R, Wrensch M. Survival and low-grade glioma: the emergence of genetic information. Neurosurg Focus. 2015;38:E6. - PMC - PubMed

Publication types

MeSH terms

Substances