
Systematic Analysis of Splice-Site-Creating Mutations in Cancer

Reyka G Jayasinghe et al. Cell Rep. .

Abstract

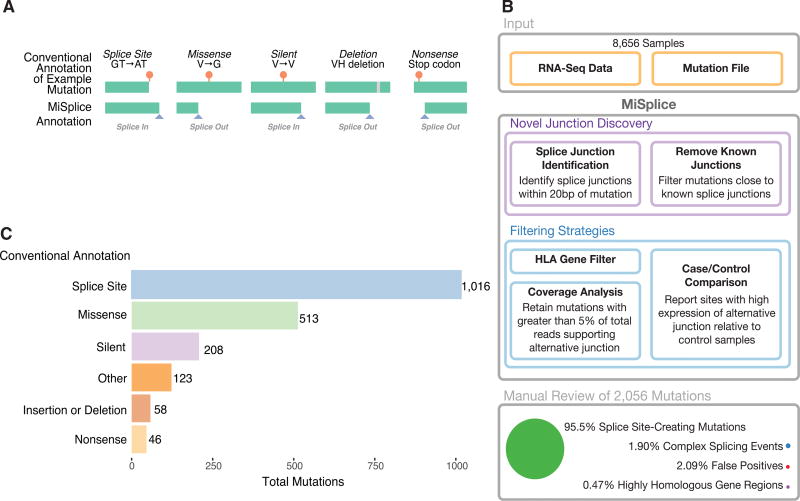
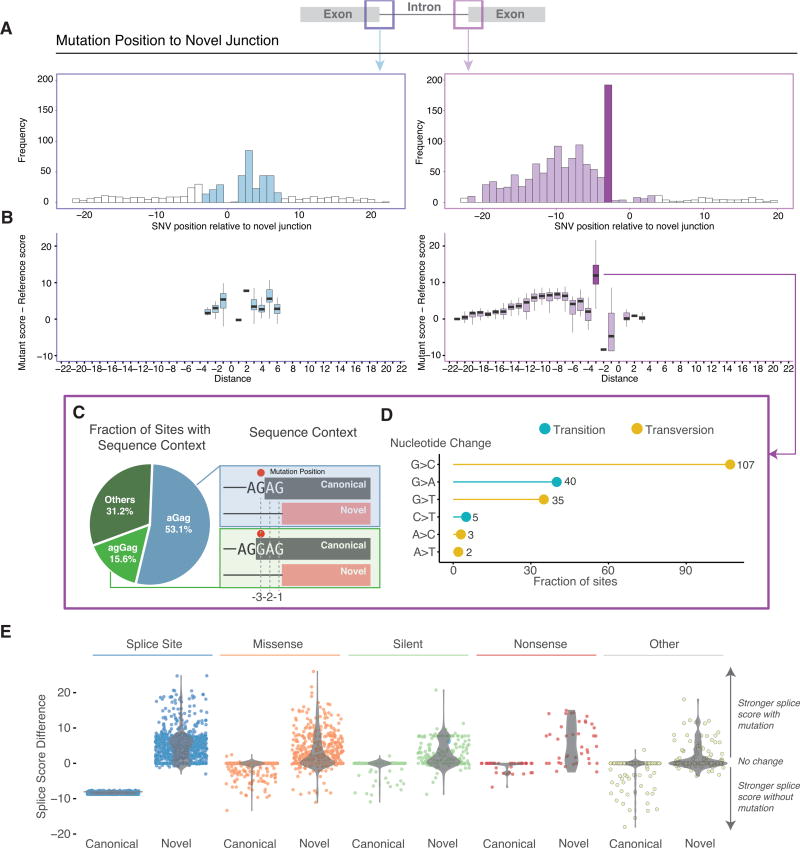
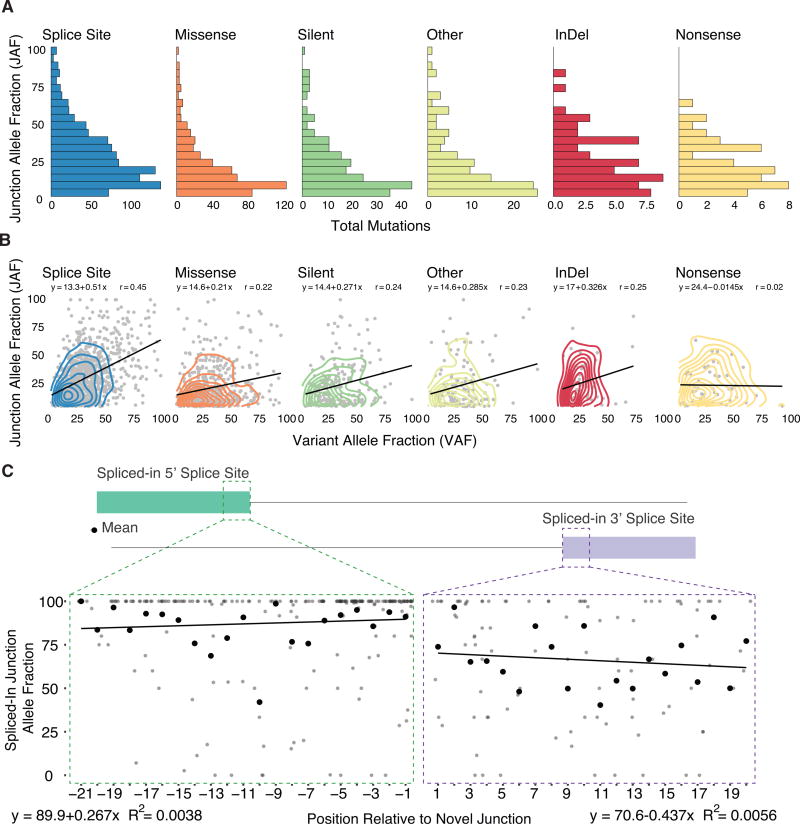
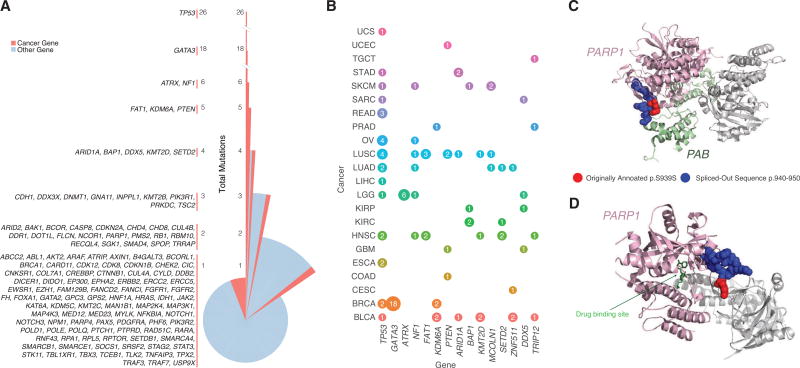
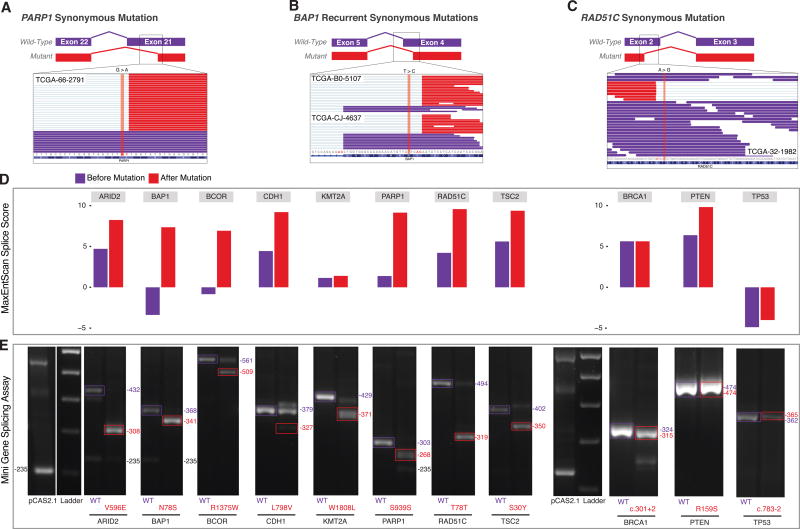
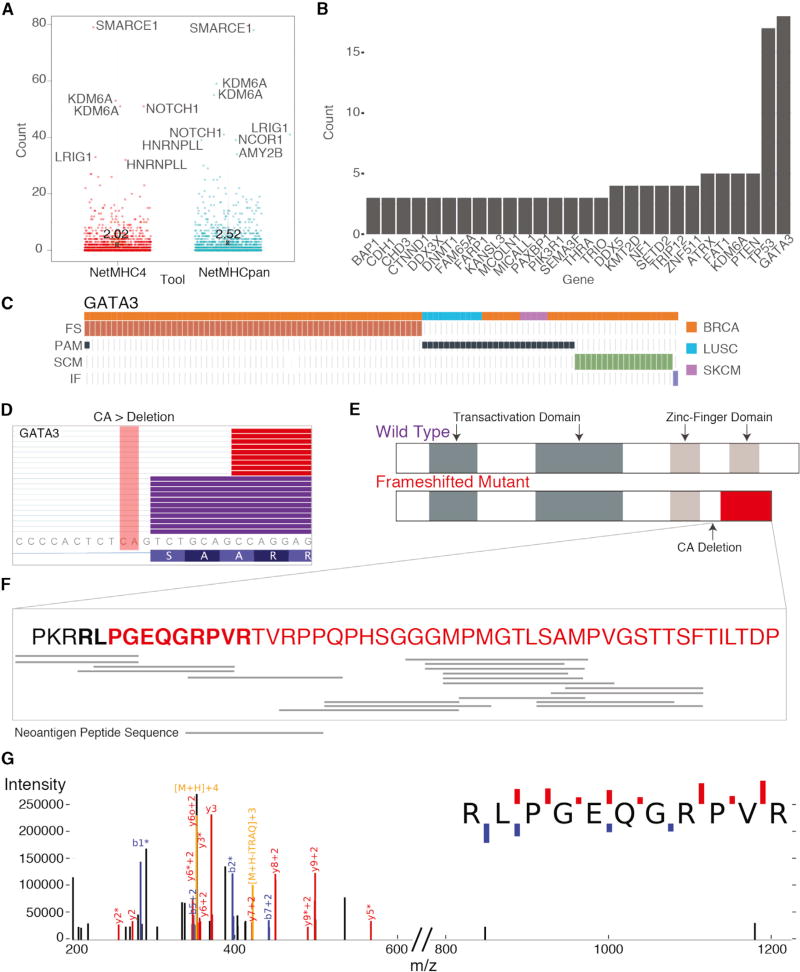
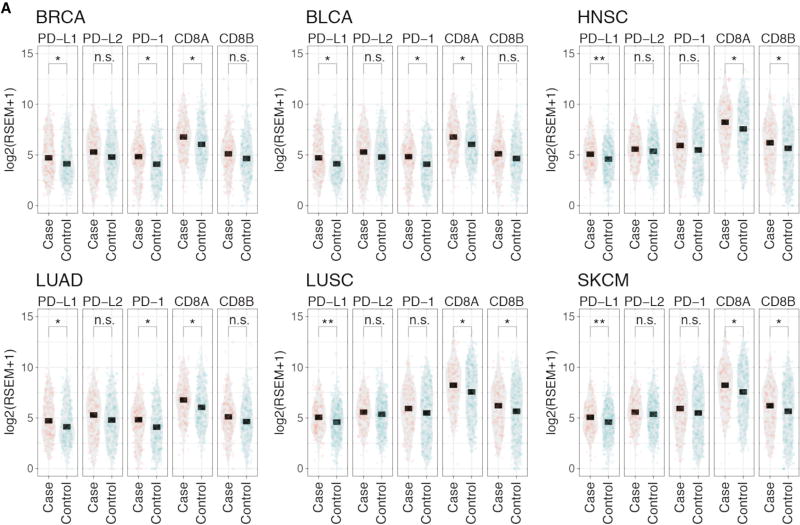
For the past decade, cancer genomic studies have focused on mutations leading to splice-site disruption, overlooking those having splice-creating potential. Here, we applied a bioinformatic tool, MiSplice, for the large-scale discovery of splice-site-creating mutations (SCMs) across 8,656 TCGA tumors. We report 1,964 originally mis-annotated mutations having clear evidence of creating alternative splice junctions. TP53 and GATA3 have 26 and 18 SCMs, respectively, and ATRX has 5 from lower-grade gliomas. Mutations in 11 genes, including PARP1, BRCA1, and BAP1, were experimentally validated for splice-site-creating function. Notably, we found that neoantigens induced by SCMs are likely several folds more immunogenic compared to missense mutations, exemplified by the recurrent GATA3 SCM. Further, high expression of PD-1 and PD-L1 was observed in tumors with SCMs, suggesting candidates for immune blockade therapy. Our work highlights the importance of integrating DNA and RNA data for understanding the functional and the clinical implications of mutations in human diseases.

Keywords: RNA; mutations of clinical relevance; splicing.


Figures

Figure 1
Figure 1. Splice-Site-Creating Mutation Discovery
(A) Examples of splice-site-creating mutations for different conventionally annotated mutation types. Splice-in is defined as mutations contained within the newly created exons, and splice-out is when the mutation is present in the newly created intron. (B) The MiSplice workflow consists of three steps: alternative junction discovery, filtering, and manual review. First, the user inputs the locations of RNA-seq BAM files along with a mutation file. MiSplice searches the BAM file to identify any alternative splice junctions near the mutation of interest, while filtering out known splice junctions and calculating the number of alternative junction-supporting reads for case and control samples. For the filtering step, the following sites are removed: mutations in HLA genes, a low fraction of reads supporting the alternative splice junction, and sites expressed in controls. Finally, we manually reviewed all sites to validate the in silico predictions. (C) Breakdown of 2,056 manually validated splice-site-creating mutations by conventional annotation.
Figure 2
Figure 2. Sequence Contexts and Characteristics of Splice-Site-Creating Mutations
(A) Frequency distribution of splice-site-creating mutations relative to the newly created splice junction, with high frequency shown at the third nucleotide position in the newly created intron. (B) Comparison of splicing scores for the newly created splice site, before (reference) and after the mutation (mutant). A larger effect of mutations at the third nucleotide position in the intron (especially for the 3′ splice sites) is shown. (C) Dominant nucleotide sequence context for splice-site-creating mutations at −3 position of the 3′ splice site. Mutation position (red dot) is present 3 base pairs away from the newly created exon. (D) Transition and transversion rate at the −3 position of the 3′ splice site. Most mutations are G > C transversions, strengthening the consensus sequence of the splicing factor U2AF1. (E) Comparison of splicing scores between the nearest canonical splice junction with and without a mutation compared to the newly created splice junction with and without a mutation. Most mutations strengthen the alternative splice junction relative to the canonical splice junction.
Figure 3
Figure 3. Junction Allele Fraction of Splice-Site-Creating Mutations
(A) The junction allele fraction (JAF) is defined as the number of reads supporting the alternative spliced junction relative to total junction spanning reads. Distribution of JAF values separated by conventional annotation type. (B) JAF versus DNA variant allele fraction (VAF) comparison by conventional annotation type. Most mutation types show a generally positive correlation between JAF and VAF values. (C) Splice-site-creating mutations expressed in the newly created exon of the alternative splice junction. Comparison of mutation position relative to the percent of reads supporting the alternative junction and mutation (spliced-in JAF). The mean of each position is highlighted by the black point. For all positions, there is a strong correlation between the presence of the splice-site-creating mutation and the alternative splice junction.
Figure 4
Figure 4. Splice-Site-Creating Mutations across Genes and Cancer Types
(A) Distribution of splice-site-creating mutations in each gene separated by the total number of mutations in each gene. TP53 has the largest number of splice-site-creating mutations, followed by GATA3 and ATRX. (B) Genes with the highest number of pancancer splice-site-creating mutations. Circle size correlates with the total number of mutations for each gene (labeled inside circle) and colored by cancer type. Splice-site-creating mutations in TP53 are present in many cancer types, while mutations in ATRX and GATA3 are specific to LGG and BRCA, respectively. (C) Proteins Timeless (PAB domain) and PARP1 (chain A) are colored green and pink, respectively. Originally annotated p.S939S mutation (red) and spliced-out sequence (blue) are highlighted on PARP1 (chain A). (D) 3D protein structure of PARP1 in complex with an inhibitor (PDB ID: 5WRQ). Drug inhibitor and PARP1 (chain A) are indicated in green and pink, respectively.
Figure 5
Figure 5. Minigene Functional Assay of Splice-Site-Creating Mutations
(A) Integrative genomics viewer (IGV) screenshot of the conventionally annotated synonymous mutation in PARP1 in exon 21. RNA-seq reads of the candidate splice-site-creating mutation reveal the creation of an alternative splice site (red reads) created by the conventionally annotated synonymous mutation. (B) Candidate recurrent splice-site-creating mutations in BAP1. Conventionally annotated as synonymous variants, the BAP1-mutated region shows alternatively spliced reads (red reads) in the IGV screenshot for each sample with the splice-site-creating mutation. (C) IGV screenshot of a conventionally annotated synonymous mutation in RAD51C in exon 2. (D) Maximum entropy score of the splice-site-creating variant before (purple) and after (red) the introduced mutation for each variant functionally validated in the mini-gene splicing assay. In silico predictions suggest all mutations strengthen the alternative splice site. (E) Candidate splice-site-creating mutations validated by the mini-gene splicing assay. Exons of interest were cloned into the pCAS2.1 vector and mutant (red); wild-type (purple) plasmids were transfected into 293T cells; and total RNA was extracted to identify mutation-induced alternatively spliced products.
Figure 6
Figure 6. Schematic of GATA3 Splice-Site-Creating Mutations and Neoantigen Predictions
(A) Distribution of neoantigens predicted by NetMHCpan and NetMHC4. Genes with the highest number of neoantigens labeled. Mean value for each tool indicated by X and labeled. (B) Genes with the largest recurrence of predicted neoantigens across the dataset. GATA3 shows the highest recurrence. (C) Mutual exclusivity of protein-affecting mutation (PAM), frameshifting indel (FS), in-frame indel (IF), and splice-site-creating mutations (SCM) in GATA3. (D) IGV screenshot of GATA3 splice-site-creating mutation, which disrupts the canonical splice site and utilizes a cryptic splice site 7 bp downstream. Mutant reads highlighted in red, and normal reads are in purple. CA deletion indicated in the figure. (E) Predicted functional domains disrupted because of the recurrent splice-site-creating mutation in GATA3. (F) Predicted neoantigen peptide sequences mapped to the frameshifted protein product for samples with GATA3 SCMs. (G) Mass spectrum of GATA3 peptide in TCGA-AR-A1AP.
Figure 7
Figure 7. PD-L1, PD-L2, PD-1, CD8A, and CD8B Expression
(A) Expression comparison of PD-L1, PD-L2, and T cell markers PD-1, CD8A, and CD8B between samples with (case) and without (control) SCMs across six cancer types. p values: * less than 0.05; ** < 0.01; and *** < 0.001; ns, not significant.

References

    1. Alshammari AH, Shalaby MA, Alanazi MS, Saeed HM. Novel mutations of the PARP-1 gene associated with colorectal cancer in the Saudi population. Asian Pac. J. Cancer Prev. 2014;15:3667–3673. - PubMed
    1. Andreatta M, Nielsen M. Gapped sequence alignment using artificial neural networks: application to the MHC class I system. Bioinformatics. 2016;32:511–517. - PMC - PubMed
    1. Boerkoel CF, Exelbert R, Nicastri C, Nichols RC, Miller FW, Plotz PH, Raben N. Leaky splicing mutation in the acid maltase gene is associated with delayed onset of glycogenosis type II. Am. J. Hum. Genet. 1995;56:887–897. - PMC - PubMed
    1. Bonnet C, Krieger S, Vezain M, Rousselin A, Tournier I, Martins A, Berthet P, Chevrier A, Dugast C, Layet V, et al. Screening BRCA1 and BRCA2 unclassified variants for splicing mutations using reverse transcription PCR on patient RNA and an ex vivo assay based on a splicing reporter minigene. J. Med. Genet. 2008;45:438–446. - PubMed
    1. Broeks A, Urbanus JHM, de Knijff P, Devilee P, Nicke M, Klöpper K, Dörk T, Floore AN, van’t Veer LJ. IVS10-6T>G, an ancient ATM germline mutation linked with breast cancer. Hum. Mutat. 2003;21:521–528. - PubMed

Publication types

MeSH terms