. 2018 Apr 3;23(1):282-296.e4.
doi: 10.1016/j.celrep.2018.01.088.

Somatic Mutational Landscape of Splicing Factor Genes and Their Functional Consequences across 33 Cancer Types

Collaborators, Affiliations

Somatic Mutational Landscape of Splicing Factor Genes and Their Functional Consequences across 33 Cancer Types

Michael Seiler et al. Cell Rep. .

Abstract

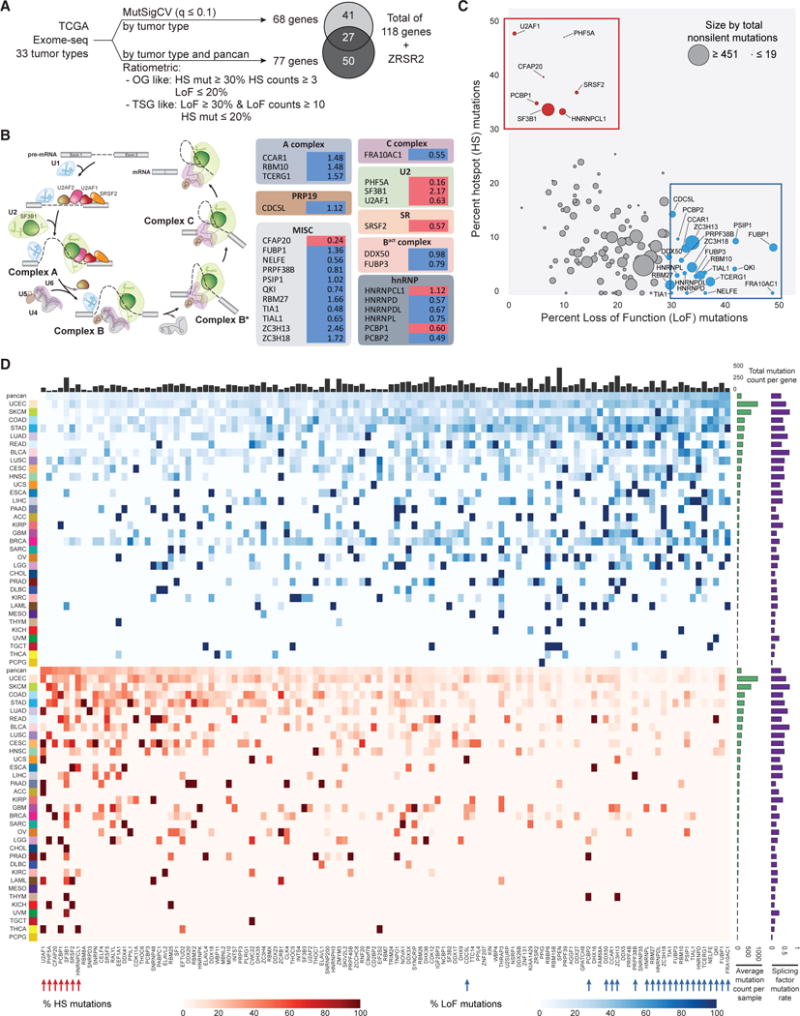
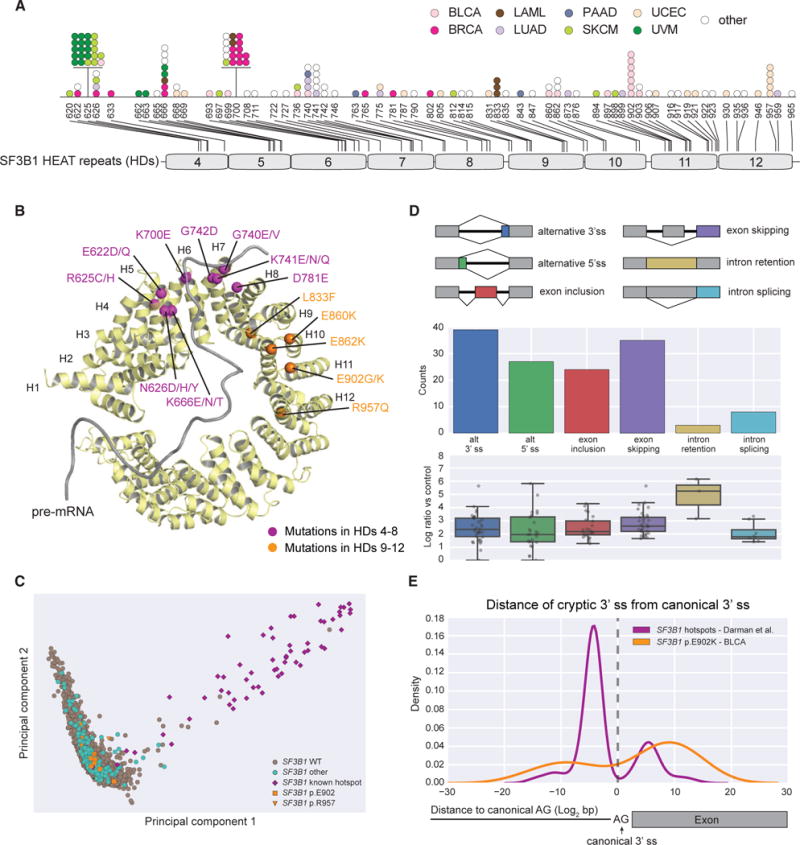
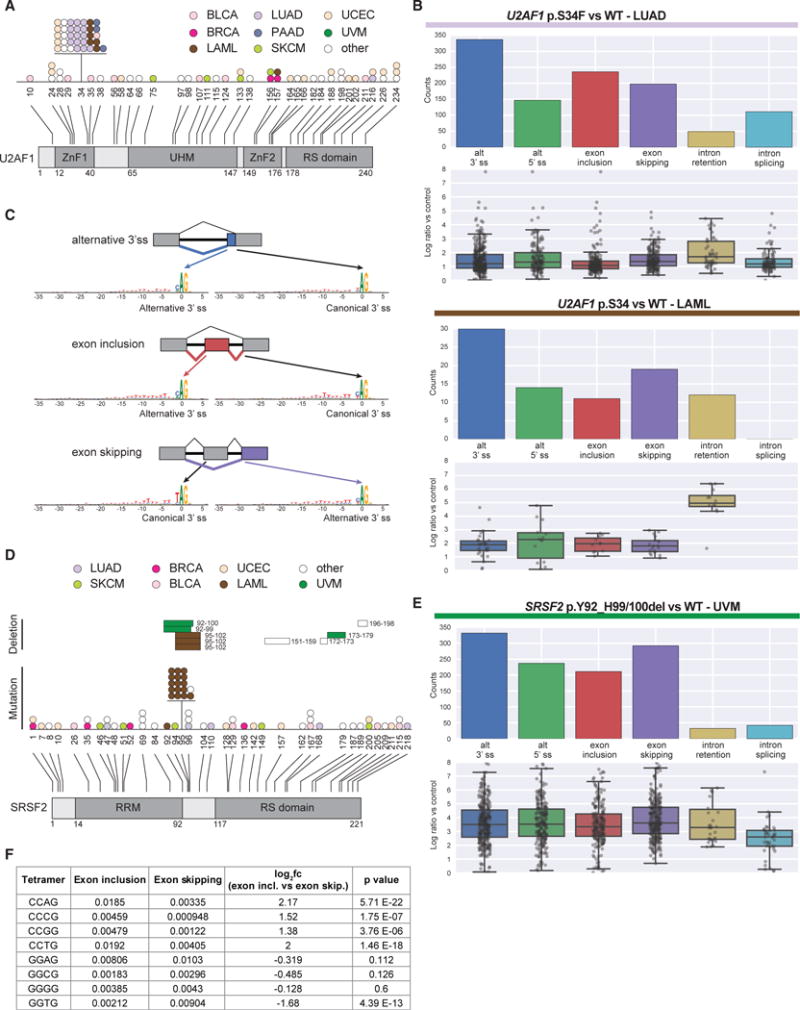
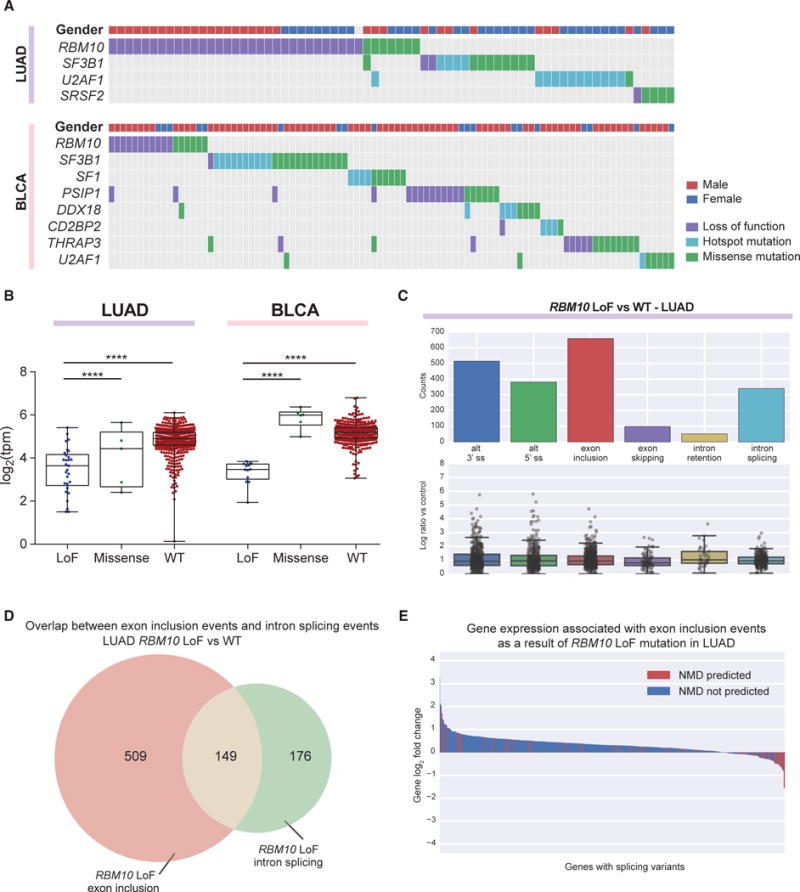
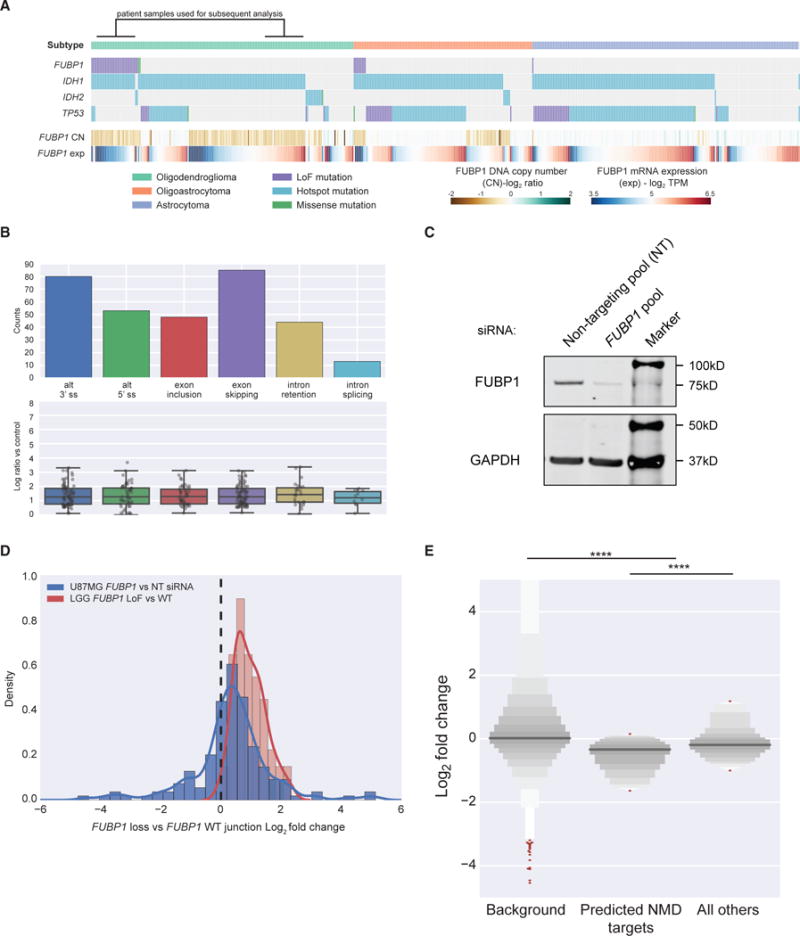
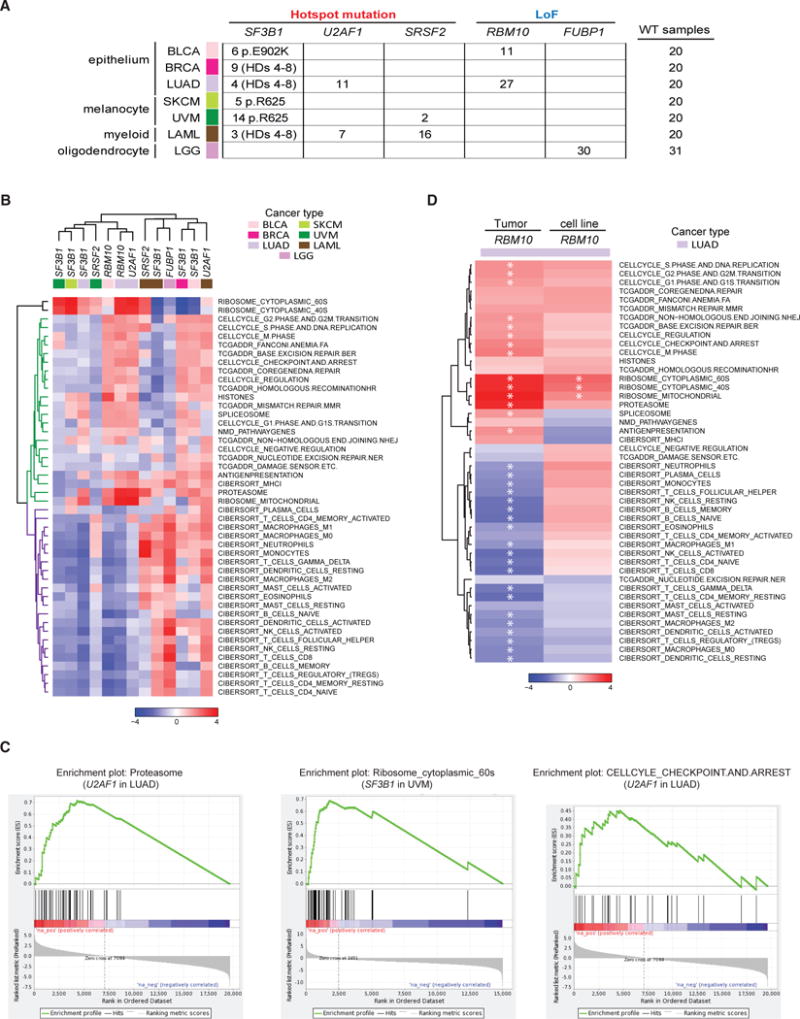
Hotspot mutations in splicing factor genes have been recently reported at high frequency in hematological malignancies, suggesting the importance of RNA splicing in cancer. We analyzed whole-exome sequencing data across 33 tumor types in The Cancer Genome Atlas (TCGA), and we identified 119 splicing factor genes with significant non-silent mutation patterns, including mutation over-representation, recurrent loss of function (tumor suppressor-like), or hotspot mutation profile (oncogene-like). Furthermore, RNA sequencing analysis revealed altered splicing events associated with selected splicing factor mutations. In addition, we were able to identify common gene pathway profiles associated with the presence of these mutations. Our analysis suggests that somatic alteration of genes involved in the RNA-splicing process is common in cancer and may represent an underappreciated hallmark of tumorigenesis.

Keywords: FUBP1; RBM10; SF3B1; SRSF2; U2AF1; cancer; mutation; splicing.


Conflict of interest statement

AUTHOR CONTRIBUTIONS

Conceptualization, L.Y.; Methodology, L.Y., M.S., S.P., and T.T.; Software, M. S. and S.P.; Investigation, M.S., S.P., L.Y., T.T., A.A.A., and J.P.; Visualization, M.S., S.P., A.A.A., and S.B.; Writing – Original Draft, M.S., S.P., A.A.A., J.P., T.T., P.Z., S.B., and L.Y.; Writing – Review & Editing, M.S., S.P., A.A.A., P.Z., P.G.S., S.B., and L.Y.; Resources, TCGA Research Network; Funding Acquisition, TCGA Research Network; Project Administration, TCGA Research Network; Supervision, S.B. and L.Y.

Figures

Figure 1
Figure 1. 119 Splicing Factor Genes Are Mutated across All Tumor Cohorts
(A) Prioritization of splicing factor genes with likely driver mutations. (B) Hotspot (HS)- (red) and loss-of-function (LoF)- (blue) mutated genes in the pancan cohort are mapped to spliceosome complexes. The percent non-silent mutation frequency (Table S1) is listed next to each gene. (C) Genes are plotted as %hotspot or %LoF mutations for non-silent mutations across TCGA (pancan). OG-like genes are colored red and TSG-like genes are colored blue. (D) Heatmap view of %hotspot (bottom orange panel) or %LoF mutations (top blue panel) of all non-silent mutations per gene in each tumor cohort, sorted by % hotspot mutation high to low and %LoF mutation low to high from left to right. Tumor cohorts are sorted by average mutation counts per sample (right green bar). For comparison, the fraction of samples with non-silent mutations in any of the 119 genes are shown as purple bars on the right. The number of samples with any non-silent mutation in each likely driver gene is given in the top bar chart. See also Figure S1 and Table S1.
Figure 2
Figure 2. SF3B1 Hotspot Mutations across Multiple Tumor Types
(A) SF3B1 somatic mutations in HDs 4-12. Each dot represents a mutant sample colored by tumor cohort. (B) SF3B1 hotspot mutations are mapped to the structure (PDB: 5GM6). Hotspots in HDs 4-8 are colored purple whereas hotspots in HDs 9-12 are colored gold. (C) PCA stratifies samples from all solid tumor cohorts with SF3B1 mutations using the expression of alternative 3′ ss associated with SF3B1 hotspot mutations in HDs 4-8. Purple, samples with hotspot mutations in HDs 4-8 (n = 57); gold, samples with p.E902 (n = 7) and p.R957 (n = 5) mutations; green, samples with missense mutations in all other locations (n = 203); gray, WT samples (n = 8,811). (D) Differential splicing events associated with the BLCA-specific SF3B1 p.E902K mutation (corrected q-value < 0.05). Below each splicing event count, the PSI log2 fold change of each individual event is detailed in a boxplot. (E) Kernel density estimation plots showing the location of alternative 3′ ss AGs with respect to canonical 3′ ss AGs preferentially used by hotspot mutations in HDs 4-8 (purple) or p.E902K in BLCA (gold). See also Figure S2 and Tables S2 and S3.
Figure 3
Figure 3. U2AF1 and SRSF2 Mutations in the Pancan Cohort and Differential Splicing Associated with Hotspot Mutations
(A) U2AF1 somatic mutations mapped to amino acid positions and annotated domains. Each dot represents a single mutant sample colored by tumor cohort. (B) Differential splicing events associated with U2AF1 p.S34F/Y hotspot mutations in LUAD and LAML (corrected q-value < 0.05). Below each splicing event count, the PSI log2 fold change of each individual event is detailed in a boxplot. (C) Consensus sequence motifs for exons preferentially used by mutant U2AF1 versus WT U2AF1 across various alternative splicing events. (D) SRSF2 somatic mutations mapped to amino acid positions and annotated domains. Each bar (in-frame deletion) and dot (other mutations) represents a singlemutant sample colored by tumor cohort. (E) Differential splicing events associated with SRSF2 in-frame deletions in UVM. (F) Tetramer (CCNG and GGNG) enrichment analysis comparing cassette exons preferentially included or excluded by SRSF2 mutant samples. Each value is the average tetramer occurrence frequency for all exons in that class. Fold change significance was assessed using Student’s t test. See also Tables S2 and S3.
Figure 4
Figure 4. RBM10 LoF Mutations Detected in LUAD and BLCA Induce Global Exon Inclusion Events
(A) RBM10 LoF mutations are mutually exclusive from other splicing factor gene mutations in LUAD and BLCA. (B) LoF mutations in RBM10 lead to reduced mRNA expression in both LUAD and BLCA. Each point depicts a sample and the boxplot whiskers depict the complete data range. ****p < 0.0001 in all comparisons, Student’s t test. (C) Differential splicing events associated with RBM10 LoF mutations in LUAD (corrected q-value < 0.05). Below each splicing event count, the PSI log2 fold change of each individual event is detailed in a boxplot. (D) Exon inclusion is often concomitant with intron splicing associated with RBM10 LoF mutation in LUAD. (E) Exons promoted by RBM10 LoF mutation in LUAD may be predicted to contain PTCs (red), leading to reduced gene expression compared to those that do not (blue). See also Figure S3 and Tables S2 and S3.
Figure 5
Figure 5. FUBP1 LoF Mutations in LGG and Associated Differential Splicing
(A) FUBP1 LoF mutations are primarily associated with IDH1 mutation and the oligodendroglioma histology in LGG. (B) Differential splicing events associated with FUBP1 LoF mutations in LGG (corrected q-value < 0.05). Below each splicing event count, the PSI log2 fold change of each individual event is detailed in a boxplot. (C) Western blot of FUBP1 protein following transfection of FUBP1 siRNA pool or non-targeting (NT) siRNA pool. (D) Log2 fold change of splice junctions identified in LGG patient samples (n = 155) in U87MG (blue) compared to LGG patient samples (red). (E) Letter-value plot showing that genes with alternative splicing events in LGG patient samples (n = 163) are significantly downregulated compared to background (n = 22,982), and genes with splicing changes predicted to result in transcripts targeted by the NMD pathway (n = 79) are significantly downregulated compared to genes not predicted to be targeted (n = 94). The y axis data range has been terminated at −5, +5 for clarity. See also Figure S4 and Tables S3 and S4.
Figure 6
Figure 6. Pathway Enrichment Analysis Using Curated Gene Sets Indicates that Cancer Pathways Altered by Splicing Factor Mutations Are Lineage Specific
(A) Splicing factor gene mutations and their associated tumor cohorts used in pathway analyses. (B) Heatmap of gene set enrichment analyses for all comparison groups generated using normalized enrichment scores (NESs) of 46 curated gene sets. Two distinct subclasses of gene sets are cell-autonomous pathways (green) and immune-related signatures (purple). (C) Representative cancer hallmark gene sets upregulated in splicing factor mutant samples. (D) Heatmap of NESs comparing patient tumor samples and cell lines, where each column represents the differential pathway modulation of RBM10 LoF mutants (n = 27 TCGA, n = 3 cell lines) versus RBM10 WT (n = 20 TCGA, n = 30 cell lines) of 46 curated gene sets. Significantly modulated gene sets (q value ≤ 0.05) are highlighted with an asterisk. See also Figure S5 and Tables S4, S5, S6, and S7.

References

    1. Anczuków O, Akerman M, Cléry A, Wu J, Shen C, Shirole NH, Raimer A, Sun S, Jensen MA, Hua Y, et al. SRSF1-regulated alternative splicing in breast cancer. Mol Cell. 2015;60:105–117. - PMC - PubMed
    1. Barbosa-Morais NL, Carmo-Fonseca M, Aparício S. Systematic genome-wide annotation of spliceosomal proteins reveals differential gene family expansion. Genome Res. 2006;16:66–77. - PMC - PubMed
    1. Bechara EG, Sebestyén E, Bernardis I, Eyras E, Valcarcel J. RBM5, 6, and 10 differentially regulate NUMB alternative splicing to control cancer cell proliferation. Mol Cell. 2013;52:720–733. - PubMed
    1. Biankin AV, Waddell N, Kassahn KS, Gingras MC, Muthuswamy LB, Johns AL, Miller DK, Wilson PJ, Patch AM, Wu J, et al. Australian Pancreatic Cancer Genome Initiative Pancreatic cancer genomes reveal aberrations in axon guidance pathway genes. Nature. 2012;491:399–405. - PMC - PubMed
    1. Brat DJ, Verhaak RG, Aldape KD, Yung WK, Salama SR, Cooper LA, Rheinbay E, Miller CR, Vitucci M, Morozova O, et al. Cancer Genome Atlas Research Network Comprehensive, integrative genomic analysis of diffuse lower-grade gliomas. N Engl J Med. 2015;372:2481–2498. - PMC - PubMed

Publication types

Substances