

Pressure gradient vs. flow relationships to characterize the physiology of a severely stenotic aortic valve before and after transcatheter valve implantation
- PMID: 29617762
- PMCID: PMC6055586
- DOI: 10.1093/eurheartj/ehy126
Pressure gradient vs. flow relationships to characterize the physiology of a severely stenotic aortic valve before and after transcatheter valve implantation
Abstract
Aims: Echocardiography and tomographic imaging have documented dynamic changes in aortic stenosis (AS) geometry and severity during both the cardiac cycle and stress-induced increases in cardiac output. However, corresponding pressure gradient vs. flow relationships have not been described.
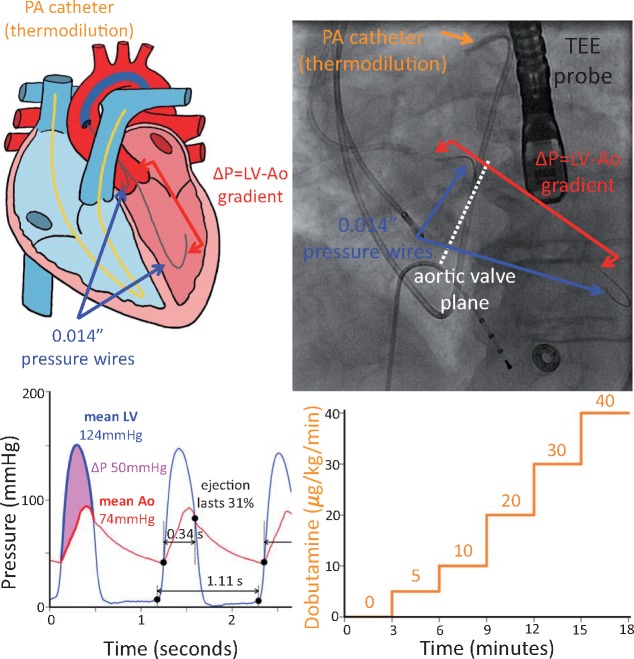
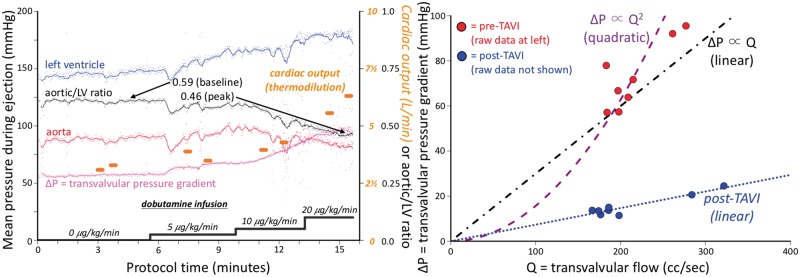
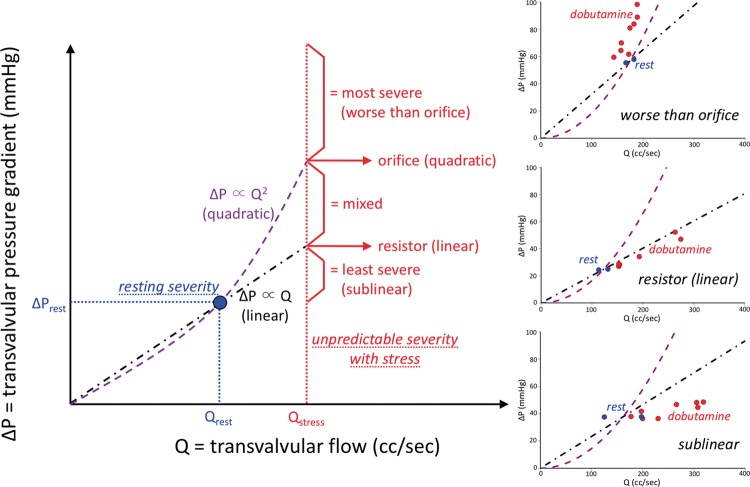
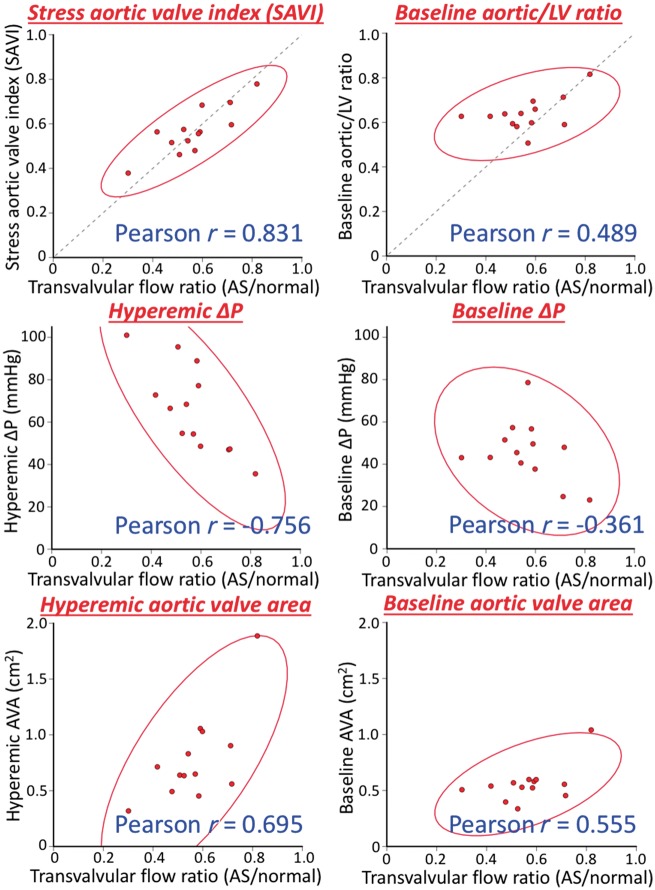
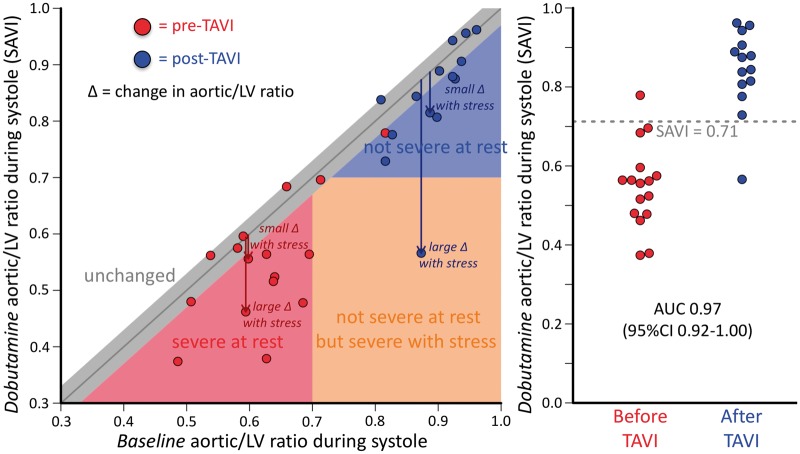
Methods and results: We recruited 16 routine transcatheter aortic valve implantations (TAVI's) for graded dobutamine infusions both before and after implantation; 0.014″ pressure wires in the aorta and left ventricle (LV) continuously measured the transvalvular pressure gradient (ΔP) while a pulmonary artery catheter regularly assessed cardiac output by thermodilution. Before TAVI, ΔP did not display a consistent relationship with transvalvular flow (Q). Neither linear resistor (median R2 0.16) nor quadratic orifice (median R2 < 0.01) models at rest predicted stress observations; the severely stenotic valve behaved like a combination. The unitless ratio of aortic to left ventricular pressures during systolic ejection under stress conditions correlated best with post-TAVI flow improvement. After TAVI, a highly linear relationship (median R2 0.96) indicated a valid valve resistance.
Conclusion: Pressure loss vs. flow curves offer a fundamental fluid dynamic synthesis for describing aortic valve pathophysiology. Severe AS does not consistently behave like an orifice (as suggested by Gorlin) or a resistor, whereas TAVI devices behave like a pure resistor. During peak dobutamine, the ratio of aortic to left ventricular pressures during systolic ejection provides a 'fractional flow reserve' of the aortic valve that closely approximates the complex, changing fluid dynamics. Because resting assessment cannot reliably predict stress haemodynamics, 'valvular fractional flow' warrants study to explain exertional symptoms in patients with only moderate AS at rest.
Figures
Comment in
-
Evaluating the severity of aortic stenosis: a re-look at our current 'gold standard' measurements.Eur Heart J. 2018 Jul 21;39(28):2656-2658. doi: 10.1093/eurheartj/ehy224. Eur Heart J. 2018. PMID: 29718147 Free PMC article. No abstract available.
References
-
- Cribier A, Eltchaninoff H, Bash A, Borenstein N, Tron C, Bauer F, Derumeaux G, Anselme F, Laborde F, Leon MB.. Percutaneous transcatheter implantation of an aortic valve prosthesis for calcific aortic stenosis: first human case description. Circulation 2002;106:3006–3008. - PubMed
-
- Capodanno D, Leon MB.. Upcoming TAVI trials: rationale, design and impact on clinical practice. EuroIntervention 2016;12:Y51–Y55. - PubMed
-
- Iung B, Laouénan C, Himbert D, Eltchaninoff H, Chevreul K, Donzeau-Gouge P, Fajadet J, Leprince P, Leguerrier A, Lièvre M, Prat A, Teiger E, Laskar M, Vahanian A, Gilard M; FRANCE 2 Investigators. Predictive factors of early mortality after transcatheter aortic valve implantation: individual risk assessment using a simple score. Heart 2014;100:1016–1023. - PubMed
-
- Edwards FH, Cohen DJ, O’brien SM, Peterson ED, Mack MJ, Shahian DM, Grover FL, Tuzcu EM, Thourani VH, Carroll J, Brennan JM, Brindis RG, Rumsfeld J, Holmes DR Jr; Steering Committee of the Society of Thoracic Surgeons/American College of Cardiology Transcatheter Valve Therapy Registry. Development and validation of a risk prediction model for in-hospital mortality after transcatheter aortic valve replacement. JAMA Cardiol 2016;1:46–52. - PubMed
-
- Hermiller JB Jr, Yakubov SJ, Reardon MJ, Deeb GM, Adams DH, Afilalo J, Huang J, Popma JJ; CoreValve United States Clinical Investigators. Predicting early and late mortality after transcatheter aortic valve replacement. J Am Coll Cardiol 2016;68:343–352. - PubMed
Publication types
MeSH terms
LinkOut - more resources
Full Text Sources
Other Literature Sources
Research Materials
