. 2018 Apr 1;7(4):1-8.
doi: 10.1093/gigascience/giy032.

A practical tool for maximal information coefficient analysis

Affiliations

A practical tool for maximal information coefficient analysis

Davide Albanese et al. Gigascience. .

Abstract

Background: The ability of finding complex associations in large omics datasets, assessing their significance, and prioritizing them according to their strength can be of great help in the data exploration phase. Mutual information-based measures of association are particularly promising, in particular after the recent introduction of the TICe and MICe estimators, which combine computational efficiency with superior bias/variance properties. An open-source software implementation of these two measures providing a complete procedure to test their significance would be extremely useful.

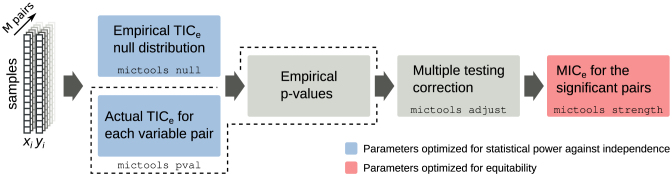
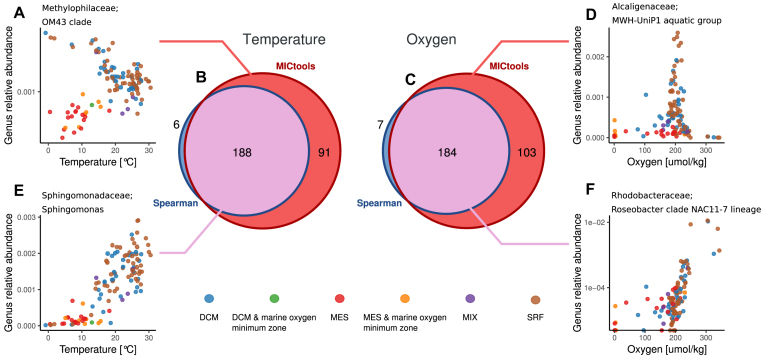
Findings: Here, we present MICtools, a comprehensive and effective pipeline that combines TICe and MICe into a multistep procedure that allows the identification of relationships of various degrees of complexity. MICtools calculates their strength assessing statistical significance using a permutation-based strategy. The performances of the proposed approach are assessed by an extensive investigation in synthetic datasets and an example of a potential application on a metagenomic dataset is also illustrated.

Conclusions: We show that MICtools, combining TICe and MICe, is able to highlight associations that would not be captured by conventional strategies.


Figures

Figure 1:
Figure 1:
The MICtools pipeline. Each step is implemented as a subcommand of the mictools main command. mictools null estimates the empirical TICe null distribution of the M variable pairs (xi, yi). mictools pval computes the TICe values and estimates their p values (boxes within the dashed line). The multiple testing correction is performed by mictools adjust. Finally, mictools strength estimates the MICe value for the subset of significant relationships. The color of the boxes highlights the criterion used for parameter optimization.
Figure 2:
Figure 2:
Analysis on SD1 dataset at the 0.05 significance level. A) Statistical power, B) number of FPs, and C) FDR for varying number of samples n. Each range represents the results of the 20 replicates. D) MICe values and E) statistical power at different levels of R2, for increasing number of samples (from 25 to 1,000, plots from left to right). Only significant relationships, i.e., relationships with q < 0.05, are shown.
Figure 3:
Figure 3:
Analysis on SD2 dataset at the 0.05 significance level. A) Statistical power, B) number of FPs, and C) FDR for increasing effect chance. Each range represents 20 replicated datasets.
Figure 4:
Figure 4:
Madelon dataset. A) Hive plots of the detected association for increasing number of samples. The variables are grouped as “informative” (5), “redundant” (15), and “random” (180). True positives (associations between nonindependent variables passing the significance test) are in blue; false positives (associations between independent variable passing the significance test) are in red. B) Power and C) false discovery rate as a function of the number of samples. D) Example of significant relationships between informative and redundant (IR) and redundant (RR) variables within the Madelon datasets with 50 and 500 samples.
Figure 5:
Figure 5:
Tara dataset: Venn diagrams of the significant relationships between the genus-level relative abundances and two environmental variables, temperature (B) and oxygen (C), identified by MICtools and the Spearman coefficient-based procedure (q< 0.01). A, D) The relationships between the OM43 clade and temperature and between the MWH-UniP1 aquatic group are detected only by MICtools. E, F) Two monotonic relationships identified by both methods. Abbreviations: DCM, deep chlorophyll maximum layer; MES, mesopelagic zone; MIX, subsurface epipelagic mixed layer; SRF, surface water layer.

References

    1. Reshef DN, Reshef YA, Finucane HK, et al. . Detecting novel associations in large data sets. Science. 2011;334(6062):1518–24. - PMC - PubMed
    1. Kinney JB, Atwal GS. Equitability, mutual information, and the maximal information coefficient. Proc Natl Acad Sci. 2014;111(9):3354–9. - PMC - PubMed
    1. Murrell B, Murrell D, Murrell H. R2-equitability is satisfiable. Proc Natl Acad Sci. 2014;111(21):E2160–E2160. - PMC - PubMed
    1. Reshef DN, Reshef YA, Mitzenmacher M, et al. . Cleaning up the record on the maximal information coefficient and equitability. Proc Natl Acad Sci. 2014;111(33):E3362–E3363. - PMC - PubMed
    1. Reshef YA, Reshef DN, Finucane HK et al. . Measuring dependence powerfully and equitably. J Mach Learn Res. 2016;17(212):1–63.

Publication types