. 2018 Jul 6;46(12):6318-6329.
doi: 10.1093/nar/gky233.

Control of mRNA decapping by autoinhibition

Affiliations

Control of mRNA decapping by autoinhibition

David R Paquette et al. Nucleic Acids Res. .

Abstract

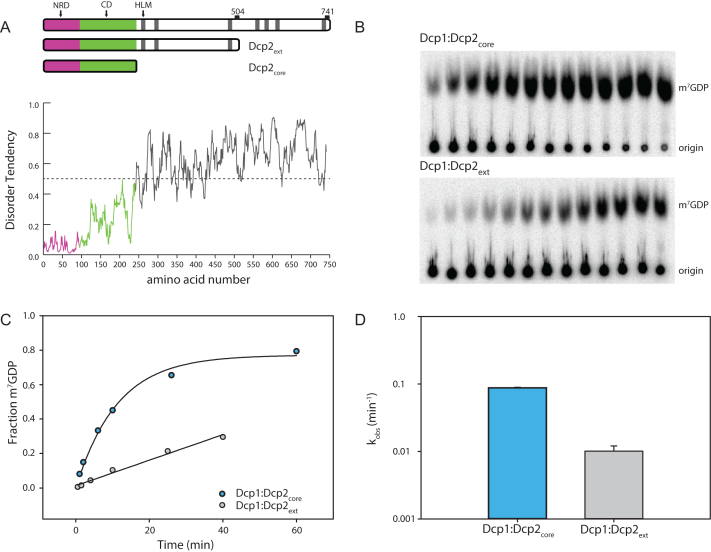
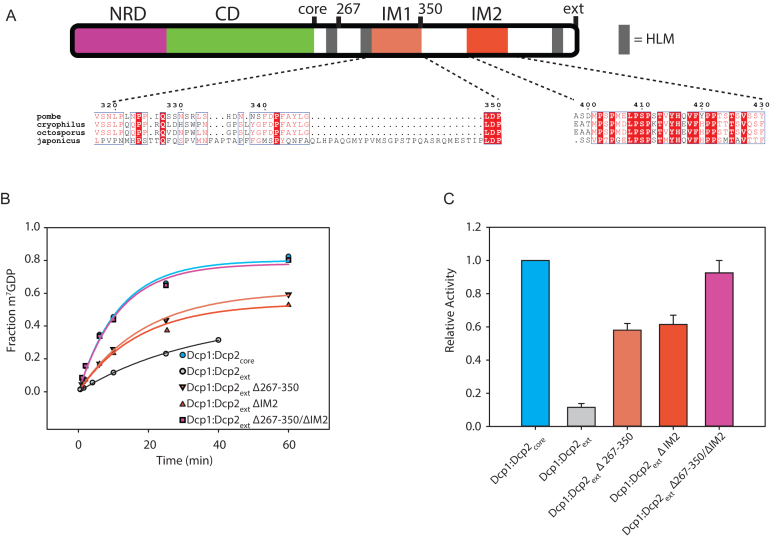
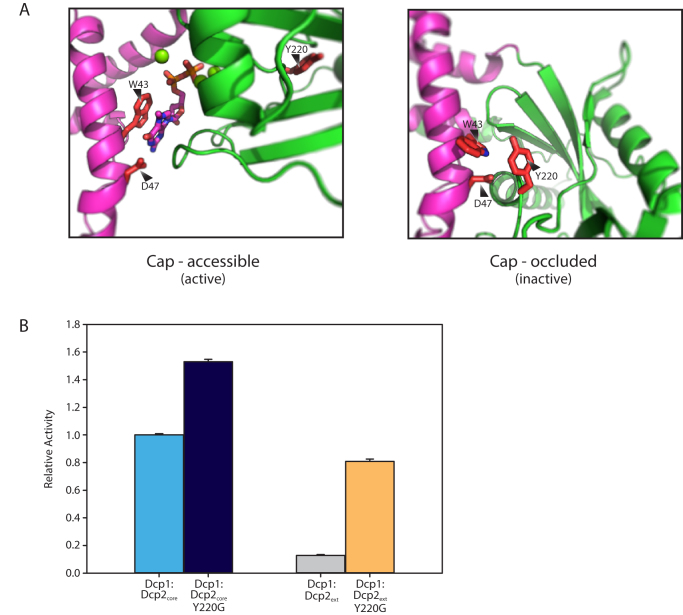
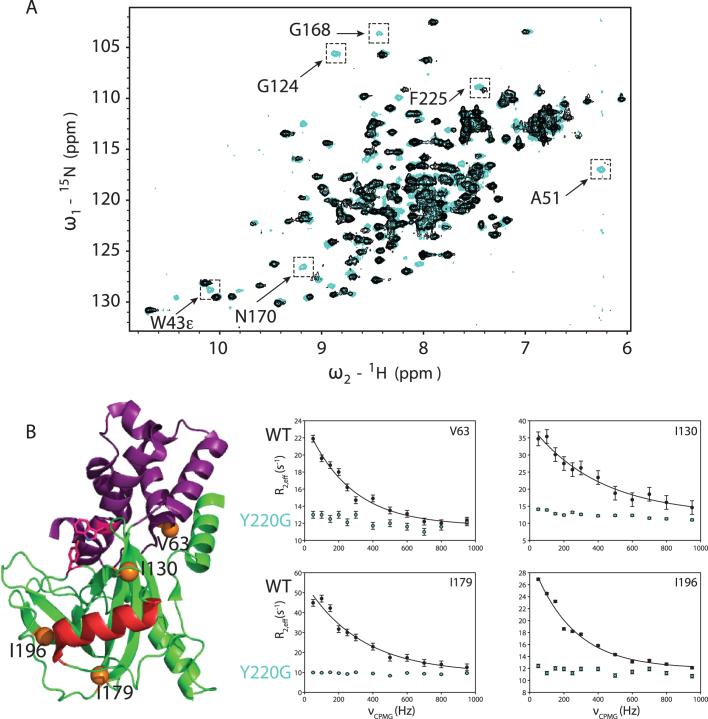
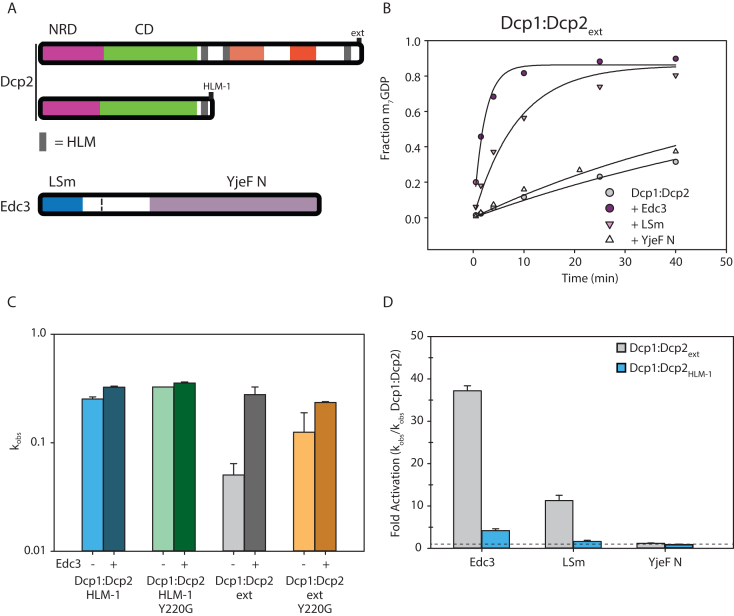
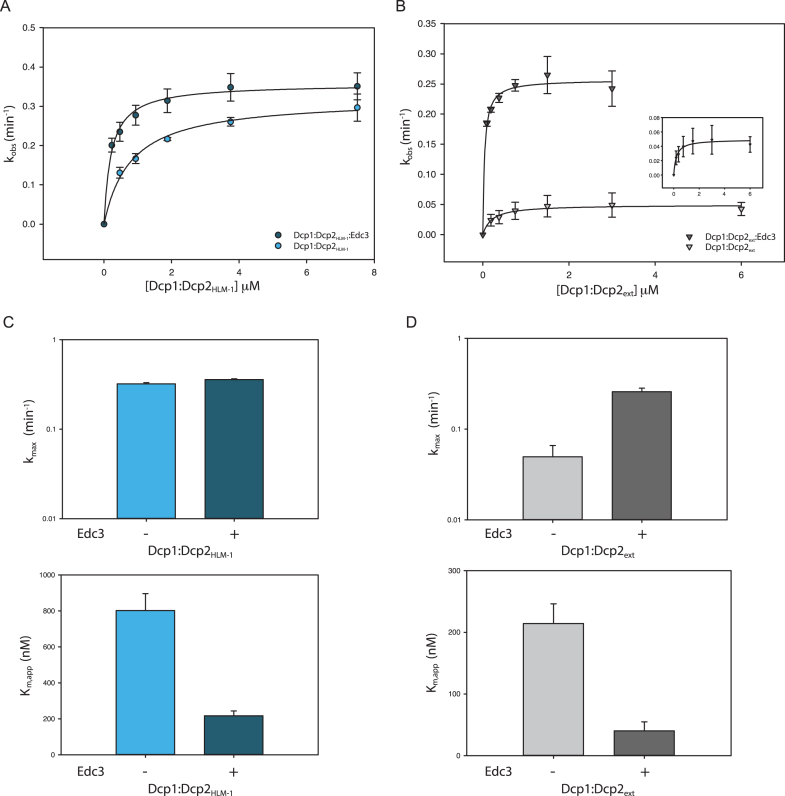
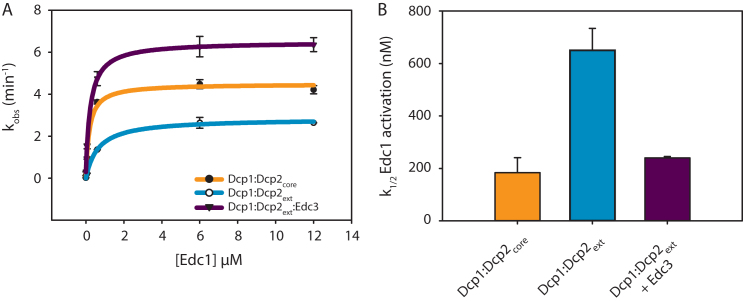
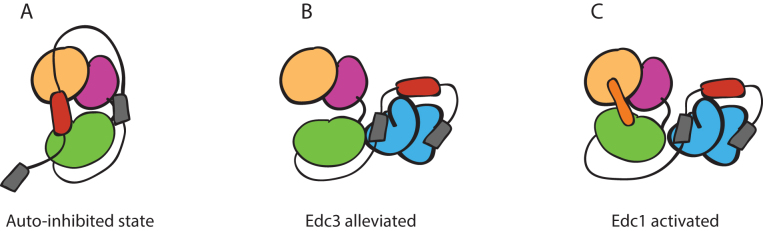
5' mediated cytoplasmic RNA decay is a conserved cellular process in eukaryotes. While the functions of the structured core domains in this pathway are well-studied, the role of abundant intrinsically disordered regions (IDRs) is lacking. Here we reconstitute the Dcp1:Dcp2 complex containing a portion of the disordered C-terminus and show its activity is autoinhibited by linear interaction motifs. Enhancers of decapping (Edc) 1 and 3 cooperate to activate decapping by different mechanisms: Edc3 alleviates autoinhibition by binding IDRs and destabilizing an inactive form of the enzyme, whereas Edc1 stabilizes the transition state for catalysis. Both activators are required to fully stimulate an autoinhibited Dcp1:Dcp2 as Edc1 alone cannot overcome the decrease in activity attributed to the C-terminal extension. Our data provide a mechanistic framework for combinatorial control of decapping by protein cofactors, a principle that is likely conserved in multiple 5' mRNA decay pathways.


Figures

Figure 1.
Figure 1.
The C-terminal extension of Dcp2 inhibits decapping. (A) Block diagram of the domains of S. pombe Dcp2. The magenta box (1-94) comprises the N-terminal regulatory domain (NRD) and the green (95–243) comprises the catalytic domain, which contains the Nudix helix. Gray bars are helical leucine-rich motifs (HLMs). The disorder tendency plot below was calculated using the IUPRED server (53) and regions above the dotted line are predicted to have a higher propensity for being disordered. (B) Representative raw TLC (thin-layer chromatography) showing the formation of m7GDP product over 40 min. The lower spots are the RNA origin and the upper are the cleaved cap. (C) Representative plot of fraction m7GDP product versus time comparing the catalytic core (Dcp1:Dcp2core) and inhibited C-terminally extended Dcp1:Dcp2ext. (D) A log-scale plot of the empirically determined rates from (C), where the error bars are the population standard deviation, σ. Difference in measured rates are significant as determined by unpaired t-test (see Supplementary Table S3).
Figure 2.
Figure 2.
Two motifs are required for autoinhibition of Dcp1:Dcp2ext. (A) Block diagram colored as in Figure 1 with IM1 and IM2 regions colored and the sequence conservation (54) for each motif shown below. IM1 contains proline and phenylalanine residues similar to the negative regulatory element identified in budding yeast (Supplementary Figure S2B), while IM2 is absolutely conserved in all fission yeast. (B) Plot with fits for fraction of m7GDP versus time comparing the activity of Dcp1:Dcp2ext where either IM1, IM2 or both are internally deleted. (C) Bar graph of the relative enzymatic activity of the various Dcp1:Dcp2ext complexes compared to Dcp1:Dcp2core. Each IM contributes to the inhibitory effect of the C-terminal regulatory region (CRR). The error bars are the population standard deviation, σ. Differences in observed rates are significant except for Dcp1:Dcp2core relative to Dcp1:Dcp2(Δ267–350/ΔIM2) and Dcp1:Dcp2(Δ267–350) relative to Dcp1:Dcp2(ΔIM2) as determined by unpaired t-test (see Supplementary Table S3).
Figure 3.
Figure 3.
Y220 stabilizes a cap-occluded state and alleviates inhibition. (A) W43 and D47 that coordinate the m7G cap exist in conformations where they are either accessible or occluded by interaction with the conserved Y220. (B) Plot of the relative activity of WT or Y220G Dcp1:Dcp2ext compared to the same mutation in Dcp1:Dcp2core. Dcp1:Dcp2ext exhibits a greater increase in kobs when Y220 is mutated as determined by an in vitro decapping assay. The error bars are the population standard deviation, σ. All differences in reported rates are significant as determined by unpaired t-test (see Supplementary Table S3).
Figure 4.
Figure 4.
Y220G mutation quenches ms-μs dynamics in Dcp2core. (A) Shown are the 15N HSQC spectra of WT Dcp2 residues 1–243 (black) and Dcp2 Y220G (cyan). Selected residues with significant changes upon mutation are indicated. (B) Location of four representative residues whose sidechain dynamics are presented are shown as orange spheres on the ATP-bound structure of Dcp2 (2QKM), where the NRD is magenta, CD is green, catalytic Nudix helix is red and W43 and Y220 are displayed as sticks. CPMG dispersion curves were recorded at 800 MHz for WT (black circles) and Y220G (cyan circles). WT data fit well to a two-site exchange model (Black lines), whereas Y220G data did not, indicating ms-μs dynamics are strongly reduced.
Figure 5.
Figure 5.
Edc3 alleviates autoinhibition of Dcp1:Dcp2ext. (A) Block diagram of the Dcp2 and Edc3 used in the subsequent decapping assays. Edc3 consists of an LSm domain that interacts with HLMs and a YjeF N domain that provides an RNA binding surface when dimerized. (B) Decapping activity of Dcp1:Dcp2ext incubated with excess Edc3, LSm domain or YjeF N domain. (C) Logscale plot of decapping rate of Dcp1:Dcp2HLM-1 [blue], Dcp1:Dcp2HLM-1 Y220G [green], Dcp1:Dcp2ext [gray], or Dcp1:Dcp2ext Y220G [orange] where the darker bar is the rate with excess Edc3. The error bars are the population standard deviation, σ. Differences in observed rates are significant except for Dcp1:Dcp2HLM-1 Y220G relative to Dcp1:Dcp2HLM-1Y220G:Edc3 and Dcp1:Dcp2ext Y220G relative to Dcp1:Dcp2ext Y220G:Edc3 as determined by unpaired t-test (see Supplementary Table S3 for P-values of all pairwise comparisons). (D) Comparison of the relative fold activation of Dcp1:Dcp2ext versus Dcp1:Dcp2HLM-1 with the various Edc3 constructs. All comparisons except between Dcp1:Dcp2ext and Dcp1:Dcp2HLM-1 in the presence of the YjeF N domain are significant as determined by unpaired t-test (see Supplementary Table S3 for P-values of all pairwise comparisons).
Figure 6.
Figure 6.
Edc3 alleviates autoinhibition and promotes RNA binding. (A) Plot of kobs versus Dcp1:Dcp2HLM-1 concentration in the absence (light blue) or presence (dark blue) of saturating concentrations of Edc3. Error bars represent population standard deviation, σ. (B) Plot of kobs versus Dcp1:Dcp2ext concentration in the absence (light gray) or presence (dark gray) of saturating concentrations of Edc3. Error bars represent population standard deviation, σ. (C) Comparison of fitted kmax (top) and Km,app (bottom) values from panel A for Dcp1:Dcp2HLM-1 with or without saturating Edc3 (colored as in panel A). There is not a significant change in kmax upon addition of Edc3 (as determined by unpaired t-test, see Supplementary Table S3) but Km,app is 5-fold decreased. (D) Comparison of fitted kmax (top) and Km,app (bottom) values from panel B for Dcp1:Dcp2ext with or without saturating Edc3 (colored as in panel B). There is a 6-fold increase in kmax upon incubation with Edc3 and Km,app decreases by 5-fold. Error bars are the population standard deviation, σ.
Figure 7.
Figure 7.
Edc1 and Edc3 coordinate to activate the Dcp1:Dcp2ext complex. (A) Plot of kobs versus Edc1 concentration for the catalytic core (orange), autoinhibited complex (cyan), or the autoinhibited complex (Dcp1:Dcp2ext) saturated with Edc3 (purple). Error bars are population standard deviation, σ. (B) Bar graphs showing the K1/2 Edc1 activation (apparent Kd) determined from the fits in panel A for Edc1 dependent activation with same colors as in A. Error bars are standard error. Differences in k1/2 are significant except for Dcp1:Dcp2core relative to Dcp1:Dcp2ext:Edc3 as determined by unpaired t-test (see Supplementary Table S3).
Figure 8.
Figure 8.
Model for autoinhibition, Edc3 alleviation and Edc3/Edc1 combined activation. (A) Autoinhibited conformation of the decapping holoenzyme. Dcp1 is yellow-gold, and the NRD and CD of Dcp2 are magenta and green, respectively. IM1&IM2, shown in red, stabilize this inactive conformation by making contacts with the core domains. The grey boxes are HLMs. (B) Edc3, shown in cyan, alleviated inhibition by binding to the HLMs, which disrupts the IM1&IM2 interaction with the Dcp1:Dcp2core. (C) Representation of the activated Dcp1:Dcp2 structure where Edc1, orange, stabilizes a composite active site formed by the NRD and CD. Edc3 frees up the Dcp1:Edc1 binding site from IM1 & IM2.

References

    1. Dunckley T., Parker R.. The DCP2 protein is required for mRNA decapping in Saccharomyces cerevisiae and contains a functional MutT motif. EMBO J. 1999; 18:5411–5422. - PMC - PubMed
    1. Wang Z., Jiao X., Carr-Schmid A., Kiledjian M.. The hDcp2 protein is a mammalian mRNA decapping enzyme. Proc. Natl. Acad. Sci. U.S.A. 2002; 99:12663–12668. - PMC - PubMed
    1. Grudzien-Nogalska E., Kiledjian M.. New insights into decapping enzymes and selective mRNA decay. Wiley Interdiscip. Rev. RNA. 2017; 8:1–11. - PMC - PubMed
    1. Song M.G., Li Y., Kiledjian M.. Multiple mRNA decapping enzymes in mammalian cells. Mol. Cell. 2010; 40:423–432. - PMC - PubMed
    1. Konarska M.M., Padgett R.A., Sharp P.A.. Recognition of cap structure in splicing in vitro of mRNA precursors. Cell. 1984; 38:731–736. - PubMed

Publication types

MeSH terms