A transcriptional factor B paralog functions as an activator to DNA damage-responsive expression in archaea
- PMID: 29618058
- PMCID: PMC6101594
- DOI: 10.1093/nar/gky236
A transcriptional factor B paralog functions as an activator to DNA damage-responsive expression in archaea
Erratum in
-
A transcriptional factor B paralog functions as an activator to DNA damage-responsive expression in archaea.Nucleic Acids Res. 2018 Aug 21;46(14):7465. doi: 10.1093/nar/gky302. Nucleic Acids Res. 2018. PMID: 29897479 Free PMC article. No abstract available.
Abstract
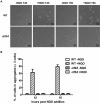
Previously it was shown that UV irradiation induces a strong upregulation of tfb3 coding for a paralog of the archaeal transcriptional factor B (TFB) in Sulfolobus solfataricus, a crenarchaea. To investigate the function of this gene in DNA damage response (DDR), tfb3 was inactivated by gene deletion in Sulfolobus islandicus and the resulting Δtfb3 was more sensitive to DNA damage agents than the original strain. Transcriptome analysis revealed that a large set of genes show TFB3-dependent activation, including genes of the ups operon and ced system. Furthermore, the TFB3 protein was found to be associated with DDR gene promoters and functional dissection of TFB3 showed that the conserved Zn-ribbon and coiled-coil motif are essential for the activation. Together, the results indicated that TFB3 activates the expression of DDR genes by interaction with other transcriptional factors at the promoter regions of DDR genes to facilitate the formation of transcription initiation complex. Strikingly, TFB3 and Ced systems are present in a wide range of crenarchaea, suggesting that the Ced system function as a primary DNA damage repair mechanism in Crenarchaeota. Our findings further suggest that TFB3 and the concurrent TFB1 form a TFB3-dependent DNA damage-responsive circuit with their target genes, which is evolutionarily conserved in the major lineage of Archaea.
Figures


Similar articles
-
The crenarchaeal DNA damage-inducible transcription factor B paralogue TFB3 is a general activator of transcription.Mol Microbiol. 2009 Jun;72(6):1487-99. doi: 10.1111/j.1365-2958.2009.06737.x. Epub 2009 May 15. Mol Microbiol. 2009. PMID: 19460096
-
An Orc1/Cdc6 ortholog functions as a key regulator in the DNA damage response in Archaea.Nucleic Acids Res. 2018 Jul 27;46(13):6697-6711. doi: 10.1093/nar/gky487. Nucleic Acids Res. 2018. PMID: 29878182 Free PMC article.
-
Sulfolobus islandicus Employs Orc1-2-Mediated DNA Damage Response in Defense against Infection by SSV2.J Virol. 2022 Dec 21;96(24):e0143822. doi: 10.1128/jvi.01438-22. Epub 2022 Nov 30. J Virol. 2022. PMID: 36448807 Free PMC article.
-
Host and viral transcriptional regulators in Sulfolobus: an overview.Extremophiles. 2013 Nov;17(6):881-95. doi: 10.1007/s00792-013-0586-9. Epub 2013 Oct 2. Extremophiles. 2013. PMID: 24085522 Review.
-
Genetic analyses in the hyperthermophilic archaeon Sulfolobus islandicus.Biochem Soc Trans. 2009 Feb;37(Pt 1):92-6. doi: 10.1042/BST0370092. Biochem Soc Trans. 2009. PMID: 19143609 Review.
Cited by
-
A Unique B-Family DNA Polymerase Facilitating Error-Prone DNA Damage Tolerance in Crenarchaeota.Front Microbiol. 2020 Jul 23;11:1585. doi: 10.3389/fmicb.2020.01585. eCollection 2020. Front Microbiol. 2020. PMID: 32793138 Free PMC article.
-
Phosphorylation of the Archaeal Holliday Junction Resolvase Hjc Inhibits Its Catalytic Activity and Facilitates DNA Repair in Sulfolobus islandicus REY15A.Front Microbiol. 2019 May 31;10:1214. doi: 10.3389/fmicb.2019.01214. eCollection 2019. Front Microbiol. 2019. PMID: 31214148 Free PMC article.
-
Early Response of Sulfolobus acidocaldarius to Nutrient Limitation.Front Microbiol. 2019 Jan 10;9:3201. doi: 10.3389/fmicb.2018.03201. eCollection 2018. Front Microbiol. 2019. PMID: 30687244 Free PMC article.
-
The FHA domain protein ArnA functions as a global DNA damage response repressor in the hyperthermophilic archaeon Saccharolobus islandicus.mBio. 2023 Aug 31;14(4):e0094223. doi: 10.1128/mbio.00942-23. Epub 2023 Jun 30. mBio. 2023. PMID: 37389462 Free PMC article.
-
PerR functions as a redox-sensing transcription factor regulating metal homeostasis in the thermoacidophilic archaeon Saccharolobus islandicus REY15A.Nucleic Acids Res. 2025 Jan 7;53(1):gkae1263. doi: 10.1093/nar/gkae1263. Nucleic Acids Res. 2025. PMID: 39727184 Free PMC article.
References
Publication types
MeSH terms
Substances
LinkOut - more resources
Full Text Sources
Other Literature Sources
Molecular Biology Databases

