. 2018 May 4;46(8):3817-3832.
doi: 10.1093/nar/gky224.

Extensive and systematic rewiring of histone post-translational modifications in cancer model systems

Affiliations

Extensive and systematic rewiring of histone post-translational modifications in cancer model systems

Roberta Noberini et al. Nucleic Acids Res. .

Abstract

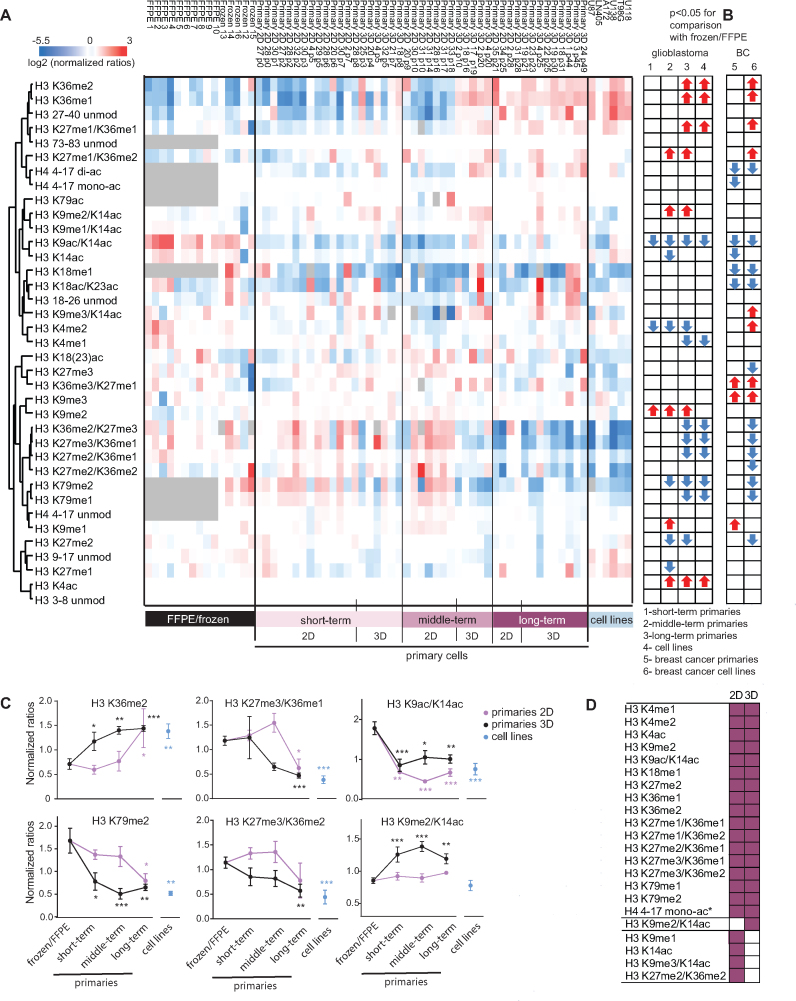
Histone post-translational modifications (PTMs) generate a complex combinatorial code that regulates gene expression and nuclear functions, and whose deregulation has been documented in different types of cancers. Therefore, the availability of relevant culture models that can be manipulated and that retain the epigenetic features of the tissue of origin is absolutely crucial for studying the epigenetic mechanisms underlying cancer and testing epigenetic drugs. In this study, we took advantage of quantitative mass spectrometry to comprehensively profile histone PTMs in patient tumor tissues, primary cultures and cell lines from three representative tumor models, breast cancer, glioblastoma and ovarian cancer, revealing an extensive and systematic rewiring of histone marks in cell culture conditions, which includes a decrease of H3K27me2/me3, H3K79me1/me2 and H3K9ac/K14ac, and an increase of H3K36me1/me2. While some changes occur in short-term primary cultures, most of them are instead time-dependent and appear only in long-term cultures. Remarkably, such changes mostly revert in cell line- and primary cell-derived in vivo xenograft models. Taken together, these results support the use of xenografts as the most representative models of in vivo epigenetic processes, suggesting caution when using cultured cells, in particular cell lines and long-term primary cultures, for epigenetic investigations.


Figures

Figure 1.
Figure 1.
Epigenetic profiling of breast cancer primary tumors, primary cells and cell lines. (A) Heatmap display and hierarchical clustering of the log2 of ratios obtained for the indicated histone PTMs for breast cancer frozen biopsies (black), primary cells (pink) and cell lines (blue). L/H relative abundances ratios obtained with the super-SILAC strategy (light channel: breast cancer biopsy, heavy channel: spike-in super-SILAC standard), normalized over the average value across the samples are shown. All frozen samples had a tumor cellularity greater than 50%, with the exception of frozen #3 and 4, which had a tumor cellularity of 20 and 30%, respectively. (B) Modified peptides significantly changing by one-way ANOVA followed by Bonferroni's post-hoc test (P< 0.05) in primary cells or cell lines compared with frozen breast cancer samples. (C) Modified peptides significantly changing by t-test (P< 0.05) in Luminal-A like and Triple Negative breast cancer cell lines compared with FFPE Luminal-A-like and Triple Negative breast cancer samples where tumor cells were isolated by laser microdissection (n = 3 for each subtype). The lighter color arrows indicate non-significant trends (P≤ 0.1). The grey color indicates those peptides that cannot be quantified in FFPE tissues. (D) Principal component analysis (normalized and centered) of the samples shown in A. (E) L/H ratios obtained for the H3K9ac/K14ac, H3K18me1 and H3K27me1/K36me3 peptides in matching frozen and primary cells. (F) Line plot showing trends of modification changes in primary cells and cell lines compared to frozen tissues. Log2 of the L/H ratios of the samples divided by the L/H average ratio for frozen samples are shown (averages from 8 frozen tumors, 9 primary cells and 12 cell lines). Peptides significantly changing (by one-way ANOVA and Bonferroni's post-hoc test, P< 0.05) in cell lines and primary cells, cell lines only, or primary cells only are shown in the left, middle and right panel, respectively. If not otherwise specified, the peptides are from histone H3. (G) L/H Ratios obtained for the H3K27me3/K36me1 and H3K9me3/K14ac peptides in Luminal-A-like (LuA) and Triple Negative (TN) FFPE tumors and cell lines. FFPE microdissected samples and cell lines belonging to the same subtype were compared by t-test (P< 0.05). Error bars represent standard error of the mean (SEM) from 3–5 samples.
Figure 2.
Figure 2.
Epigenetic profiling of GBM culture models. (A) Heatmap display of the log2 of ratios obtained for the indicated histone PTMs for GBM frozen/FFPE primary tumors, primary cells (divided in early-, middle- and long-term cultures; or 2D and 3D cultures) and cell lines. L/H relative abundances ratios obtained with the super-SILAC strategy normalized over the average value across the samples are shown. Modified peptides significantly changing in primary cultures (divided in early-, middle- and long-term) or cell lines compared with FFPE/frozen GBM samples are indicated by arrows on the right. Grey: not quantified. (B) Modified peptides significantly changing in primary breast cancer (BC) primary cultures or cell lines compared with frozen breast cancer biopsies. (C) Normalized ratios for GBM FFPE/frozen, 2D and 3D primary cultures followed over time and cell lines. (D) Summary of histone PTM changes in GBM 2D and 3D cultures. Significance in A, C and D was defined by comparing the samples to frozen/FFPE by one-way ANOVA and Bonferroni's post-hoc test, P< 0.05. Error bars in C represent SEM from 3–13 samples. *P< 0.05, **P< 0.01, ***P< 0.001.
Figure 3.
Figure 3.
A common histone PTM rearrangement in different culture models. (A) Heatmap display of the log2 of ratios obtained for the indicated histone PTMs for ovarian cancer frozen primary tumors, primary cells and cell lines. L/H relative abundances ratios obtained with the super-SILAC strategy normalized over the average value across the samples are shown. Modified peptides significantly changing in primary cultures or cell lines compared with frozen tumors are indicated by arrows on the right (P<0.05, lighter color corresponds to P< 0.1). (B) Summary of the modified peptides significantly changing in breast cancer (BC), GBM and ovarian cancer (OC) cultures. The majority of these changes were also detected in breast and brain cultures (the detailed heatmap display for these experiments can be found in Supplementary Figure S4). Grey: not quantified. The asterisk indicates that the modified peptides was not quantified in brain tissue, but the change was observed in long- vs short-term cultures. The lighter color corresponds to P<0.1 for ovarian cancer samples, and trends for normal breast samples (see Materials and Methods). (C) Principal component analysis (normalized and centered) of tumor tissue and cell lines for the cancer models analyzed. The breast samples also include FFPE laser microdissected tumor populations, which are indicated by empty circles and cluster with the other breast cancer samples. (D) Examples of two modified peptides showing significant differences in the frozen samples belonging to distinct tumor models. The differences were lost/reduced in cell lines. Error bars represent standard error from 3–8 samples. *P< 0.05 by one way-ANOVA and Bonferroni's post-hoc test.
Figure 4.
Figure 4.
Gene expression and global proteomic analysis of GBM cultures. (A) Gene expression analysis of the indicated HMEs in frozen tumors and short-term and long-term GBM primary cells. Samples were compared by one way ANOVA and Bonferroni's post-hoc test. *P< 0.05. Error bars represent SEM from 4–5 biological replicates. (B) Summary of results obtained by gene expression analysis. Red and blue arrows indicate significant changes (as indicated in (A)), lighter color arrows indicate non-significant trends (P< 0.1). (C) NSD2, NSD3 and SETMAR mRNA levels measured by RT-qPCR analysis in glioblastoma primary cells from patient #4 expressing target-specific shRNAs, normalized over the enzyme levels in the shScramble cells. Error bars represent SEM from 3 technical replicates. (D) NSD2, NSD3 and SETMAR protein levels in the same samples as in (C), measured by MS analysis of gel bands corresponding to the molecular weights of NSD2 and NSD3 (152.5 and 162 KDa) or SETMAR (76 kDa). IBAQ values from two technical replicates, normalized over shScramble cells, are shown. Error bars indicate SEM. (E) Analysis of histone PTM levels in glioblastoma primary cells expressing NSD2, NSD3 and SETMAR shRNAs. Histone H3 peptides containing K36me1, K36me2 and K27me3 were quantified by MS and normalized over shScramble cells. (F) Immunoblot analysis and densitometric quantification (normalized to the tissue sample) of the matching tumor tissue and primary short- and long-term cultures analyzed by global proteomics. Non-relevant lanes were removed. Three biological replicates for short- and long-term cells were compared to the tissue by Student's t-test, *P< 0.05. The complete blots corresponding to the replicates can be found in Supplementary Figure S6. (G) Volcano plots showing significantly up- and down-regulated proteins by comparing short-term primary 3D glioblastoma cultures and tumor tissue (left), and long- and short- term cultures (right). Differential protein expression cutoff: FDR < 0.01, S0 = 5 (left) and S0 = 1 (right). (H) Enrichment of GO biological process (BP) terms in the up- and down-regulated proteins from (G). Each tree-map includes all biological process terms mapped to a high hierarchical level. The size of the boxes corresponds to the number of proteins in that category. The grey color in the top-left plot include: regulation of heterotypic cell-cell adhesion, single organism cellular process, signaling response to inorganic substance, cell communication, regulation of biological quality, acute inflammatory response, immune system process, acute inflammatory response, neural nucleus development, multicellular organism process, developmental process, response to stimulus, signaling, locomotion, localization, glycosaminoglycan synthesis, immune system process, cell activation, intermediate filament-based process. In the top-right plot: VEGFR signaling pathway and single-organism cellular process. In the bottom-right: developmental process, positive regulation of protein autophosphorylation, cellular response to abiotic stimulus, collagen-activated signaling pathway.
Figure 5.
Figure 5.
Histone modifications revert in xenograft models. (A) Heatmap display of the log2 of ratios obtained for the indicated histone PTMs for FFPE primary tumors, primary cells, cell lines and xenografts deriving from primary cells or cell lines. L/H relative abundances ratios obtained with the super-SILAC strategy normalized over the average value across the samples are shown. Modified peptides significantly changing in primary cultures, cell lines or xenografts compared with FFPE/frozen GBM samples are indicated with arrows. Grey: not quantified. (B) Principal component analysis (normalized and centered) of the samples shown in A. (C) Normalized ratios for specific peptides from (A). Significance in A–C was defined by one-way ANOVA and Bonferroni's post-hoc test, P< 0.05. Error bars in C represent SEM from 4–9 samples. *P< 0.05, **P< 0.01, ***P< 0.001.

Similar articles

Cited by

References

    1. Jenuwein T., Allis C.D.. Translating the histone code. Science. 2001; 293:1074–1080. - PubMed
    1. Bannister A.J., Kouzarides T.. Regulation of chromatin by histone modifications. Cell Res. 2011; 21:381–395. - PMC - PubMed
    1. Portela A., Esteller M.. Epigenetic modifications and human disease. Nat. Biotechnol. 2010; 28:1057–1068. - PubMed
    1. Suva M.L., Riggi N., Bernstein B.E.. Epigenetic reprogramming in cancer. Science. 2013; 339:1567–1570. - PMC - PubMed
    1. Albert M., Helin K.. Histone methyltransferases in cancer. Semin. Cell Dev. Biol. 2010; 21:209–220. - PubMed

Publication types

MeSH terms