Review
. 2018 May 20:47:595-616.
doi: 10.1146/annurev-biophys-062215-010954. Epub 2018 Apr 4.

Behavioral Variability and Phenotypic Diversity in Bacterial Chemotaxis

Affiliations
Review

Behavioral Variability and Phenotypic Diversity in Bacterial Chemotaxis

Adam James Waite et al. Annu Rev Biophys. .

Abstract

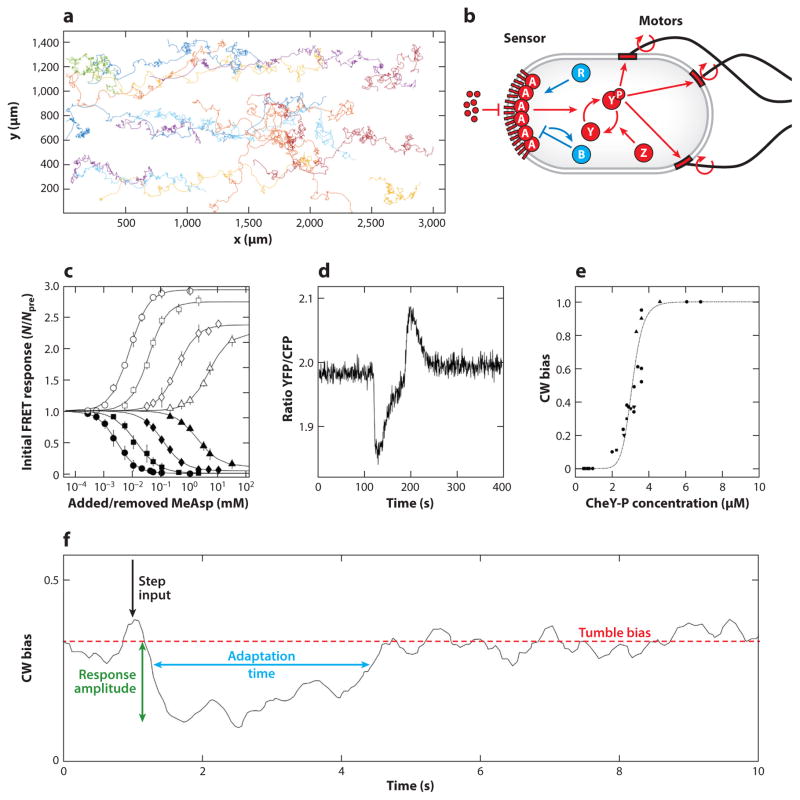
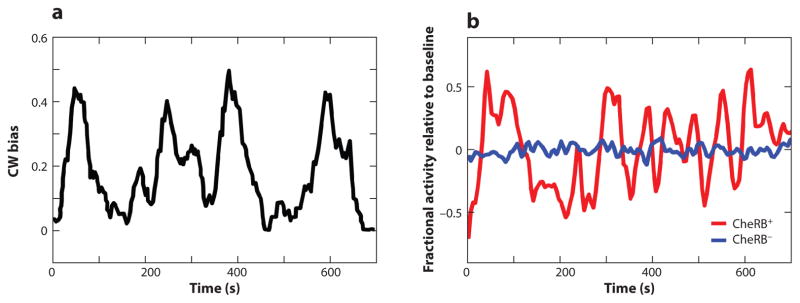
Living cells detect and process external signals using signaling pathways that are affected by random fluctuations. These variations cause the behavior of individual cells to fluctuate over time (behavioral variability) and generate phenotypic differences between genetically identical individuals (phenotypic diversity). These two noise sources reduce our ability to predict biological behavior because they diversify cellular responses to identical signals. Here, we review recent experimental and theoretical advances in understanding the mechanistic origin and functional consequences of such variation in Escherichia coli chemotaxis-a well-understood model of signal transduction and behavior. After briefly summarizing the architecture and logic of the chemotaxis system, we discuss determinants of behavior and chemotactic performance of individual cells. Then, we review how cell-to-cell differences in protein abundance map onto differences in individual chemotactic abilities and how phenotypic variability affects the performance of the population. We conclude with open questions to be addressed by future research.

Keywords: adaptation; chemical sensing; fluctuations; navigation; signal transduction; single-cell behavior.


Figures

Figure 1
Figure 1
Bacterial chemotaxis. (a) Trajectories of individual Escherichia coli cells (RP437) climbing a linear gradient of attractant [0.1 mM/mm α-methyl-DL-aspartate (MeAsp) increasing with x; 4 min trajectories at 20 frames/s]. (b) Signals are detected through transmembrane receptors, which, together with the adaptor protein CheW and the kinase CheA, form a complex that amplifies the signals via allosteric interactions. Changes in kinase activity are rapidly communicated to the flagellar motors through phosphorylation of the response regulator CheY. The phosphatase CheZ opposes the kinase activity of CheA. At a slower timescale, adaptation of the receptor complex to its steady-state activity level is mediated by CheR and CheB, which methylate and demethylate receptors at rates that depend on receptor activity level. Methylation desensitizes the receptors to ligand while respectively increasing receptor activity. Abbreviations: A, CheA; B, CheB; P, P, phosphorylated form of the protein; R, CheR; Y, CheY; Z, CheZ. (c) Initial response of the kinase activity in a population of ~400 cells to step increase (closed symbols) and decrease (open symbols) of MeAsp after complete adaptation to background concentrations (from left to right) of 0, 0.1, 0.5, and 5 mM, measured using Förster resonance energy transfer (FRET) between CheY-YFP and CheZ-CFP. Abbreviations: N, number of FRET pairs after the stimulus; Npre, number of FRET pairs before the stimulus. (d ) Kinase (FRET) activity as a function of time in response to addition and removal of 10 μM of MeAsp. Abbreviations: CFP, cyan fluorescent protein; YFP, yellow fluorescent protein. (e) Probability of individual motors to spin clockwise (CW) as a function of CheY-P concentration, Yp, measured simultaneously in individual cells. Line: Ypn/(Ypn+Kn) with K = 3.1 μM and n = 10.3. (f ) Step response of the E. coli chemotaxis system to L-aspartate or MeAsp measured using the tethered cell assay and averaging over 227 records comprising 5,040 reversals of 10 cells responding to either signal. Colors indicate key functional parameters of the chemotaxis system. Panels b, c, d, e, and f are adapted with permission from References , , , , and , respectively.
Figure 2
Figure 2
(a) Clockwise (CW) bias of an individual motor on a wild-type cell averaged with a 30-s sliding window. Panel adapted with permission from Reference . (b) Single-cell Förster resonance energy transfer measurements of the fractional kinase activity minus its mean in a wild-type and in a CheRB cell. Data are averaged with a 15-s sliding window. Panel adapted with permission from Reference .
Figure 3
Figure 3
(a) Clockwise bias ( gray) and run-direction decorrelation time (black)—how long a cell is able to sustain a run in a given direction before a tumble or rotational diffusion kicks in—as a function of adapted mean CheY-P concentration for a cell in a shallow gradient of α-methyl-DL-aspartate Green indicates time-dependent change of the intracellular concentration of CheY-P in a cell that swims up a gradient of attractant. Red indicates the same quantity but for a cell that swims down the same gradient of attractant. Two phenotypes with low (0.01) and high (0.5) tumble bias are shown. It is assumed that at the start of the run the concentration of CheY-P is at its mean adapted value. The intersection with the black curve indicates when the cell is expected to tumble. The difference between the duration of runs up and down the gradient, and therefore the drift velocity, is larger for cells with a mean adapted CheY-P level located where the black curve is steepest. (b) Drift velocity as a function of adapted mean CheY-P concentration for cells with different adaptation times. Dots are from agent-based simulations of a model similar to that in Section 1.4, and curves are analytic predictions. Adapted with permission from Reference .
Figure 4
Figure 4
Performance consequences of phenotypic diversity. (a) Conceptual overview of the connection between protein expression, phenotype, performance, and fitness. The genetic network architecture converts protein expression to phenotypic parameters, while the environment converts these phenotypic parameters to performance profiles. Finally, performance is converted to fitness through a selection function. Panel a is adapted with permission from Reference . (b) Genetically identical cells categorized by tumble bias (shown in inset) display differential performance in a race up a gradient of α-methyl-DL-aspartate (colored dots). A quantitative model (solid lines; see Section 1.4) that only assumed cell-to-cell differences in gene expression was sufficient to recapitulate the results. (c) Population performance (right) is the convolution of a population’s phenotypic distribution (left) and the performance of each phenotype (center). Because of this, nonlinearities in the phenotype-to-performance function (center, dark beige) can result in two populations with the same mean performance (left, red and blue) that display very different population performance (right). Thus, knowing the performance of the average phenotype is in general not sufficient to predict how the population will perform. Panels b and c are adapted with permission from Reference .

References

    1. Ackermann M. A functional perspective on phenotypic heterogeneity in microorganisms. Nat Rev Microbiol. 2015;13:497–508. - PubMed
    1. Adler J. Chemotaxis in bacteria. Science. 1966;153:708–16. - PubMed
    1. Adler J. A method for measuring chemotaxis and use of the method to determine optimum conditions for chemotaxis by Escherichia coli. J Gen Microbiol. 1973;74:77–91. - PubMed
    1. Alexander RP, Zhulin IB. Evolutionary genomics reveals conserved structural determinants of signaling and adaptation in microbial chemoreceptors. PNAS. 2007;104:2885–90. - PMC - PubMed
    1. Alon U, Surette MG, Barkai N, Leibler S. Robustness in bacterial chemotaxis. Nature. 1999;397:168–71. - PubMed

Publication types

LinkOut - more resources