. 2018 Apr 4;19(1):234.
doi: 10.1186/s12864-018-4625-x.

EnrichedHeatmap: an R/Bioconductor package for comprehensive visualization of genomic signal associations

Affiliations

EnrichedHeatmap: an R/Bioconductor package for comprehensive visualization of genomic signal associations

Zuguang Gu et al. BMC Genomics. .

Abstract

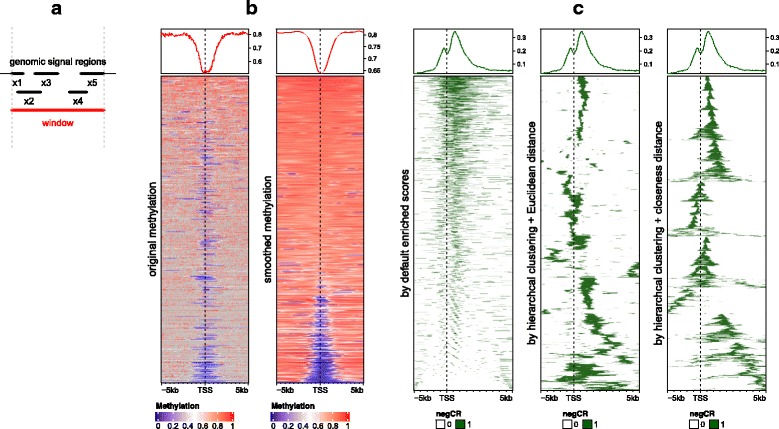
Background: High-throughput sequencing data are dramatically increasing in volume. Thus, there is urgent need for efficient tools to perform fast and integrative analysis of multiple data types. Enriched heatmap is a specific form of heatmap that visualizes how genomic signals are enriched over specific target regions. It is commonly used and efficient at revealing enrichment patterns especially for high dimensional genomic and epigenomic datasets.

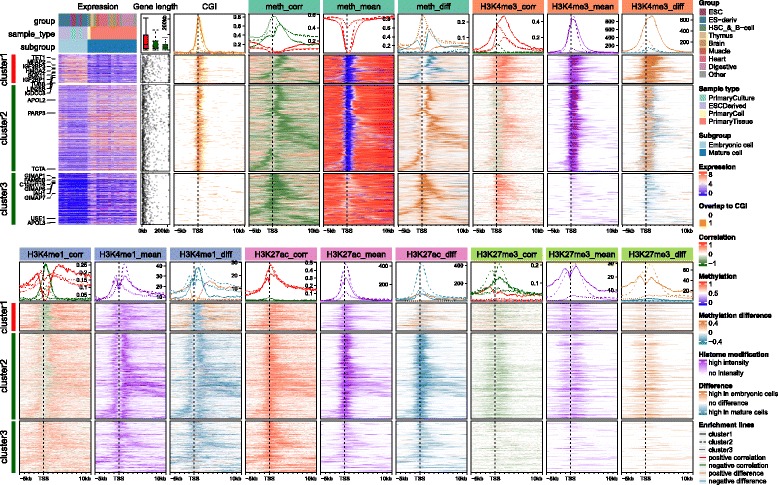
Results: We present a new R package named EnrichedHeatmap that efficiently visualizes genomic signal enrichment. It provides advanced solutions for normalizing genomic signals within target regions as well as offering highly customizable visualizations. The major advantage of EnrichedHeatmap is the ability to conveniently generate parallel heatmaps as well as complex annotations, which makes it easy to integrate and visualize comprehensive overviews of the patterns and associations within and between complex datasets.

Conclusions: EnrichedHeatmap facilitates comprehensive understanding of high dimensional genomic and epigenomic data. The power of EnrichedHeatmap is demonstrated by visualization of the complex associations between DNA methylation, gene expression and various histone modifications.

Keywords: Genomic signal enrichment; Parallel heatmap; Visualization.


Conflict of interest statement

Ethics approval and consent to participate

Not applicable.

Consent for publication

Not applicable.

Competing interests

The authors declare that they have no competing interests.

Publisher’s Note

Springer Nature remains neutral with regard to jurisdictional claims in published maps and institutional affiliations.

Figures

Fig. 1
Fig. 1
Implementation of EnrichedHeatmap. a Averaging model. The red line represents one window in the target regions or in the flanking regions when normalizing genomic signals to target regions. Black lines represent genomic signals that overlap to the given window. b Comparison between original methylation values and smoothed values. Grey color means no available methylation value associated for the window. Methylation data is from lung tissue in Roadmap dataset. Only data on chromosome 21 is used. Note the two heatmaps are independent and have different orderings. c Comparison between different row ordering methods. The three heatmaps correspond to ordering by enriched scores, by hierarchical clustering with Euclidean distance and by hierarchical clustering with closeness distance. The genomic signals are regions showing significant negative correlation between DNA methylation and expression of target genes
Fig. 2
Fig. 2
Comprehensive visualization of associations between gene expression, DNA methylation and four histone modifications from Roadmap dataset. In both top and bottom heatmap lists, rows correspond to same genes with different signals associated. Detailed explanation of data processing and R code for the plot can be found in Additional file 1

References

    1. Stricker SH, Köferle A, Beck S. From profiles to function in epigenomics. Nat Rev Genet. 2016;18:51–66. doi: 10.1038/nrg.2016.138. - DOI - PubMed
    1. Ramírez F, Dündar F, Diehl S, Grüning BA, Manke T. deepTools: a flexible platform for exploring deep-sequencing data. Nucleic Acids Res. 2014;42:W187–W191. doi: 10.1093/nar/gku365. - DOI - PMC - PubMed
    1. Shen L, Shao N, Liu X, Nestler E. ngs.plot: Quick mining and visualization of next-generation sequencing data by integrating genomic databases. BMC Genomics. 2014;15:284. doi: 10.1186/1471-2164-15-284. - DOI - PMC - PubMed
    1. Akalin A, Franke V, Vlahovi ek K, Mason CE, Schubeler D. Genomation: a toolkit to summarize, annotate and visualize genomic intervals. Bioinformatics. 2015;31:1127–1129. doi: 10.1093/bioinformatics/btu775. - DOI - PubMed
    1. Gu Z, Eils R, Schlesner M. Complex heatmaps reveal patterns and correlations in multidimensional genomic data. Bioinformatics. 2016;32:2847–2849. doi: 10.1093/bioinformatics/btw313. - DOI - PubMed