. 2018 Apr 4;18(1):160.
doi: 10.1186/s12879-018-3072-2.

Filaria specific antibody response profiling in plasma from anti-retroviral naïve Loa loa microfilaraemic HIV-1 infected people

Affiliations

Filaria specific antibody response profiling in plasma from anti-retroviral naïve Loa loa microfilaraemic HIV-1 infected people

Ghislain Donald Njambe Priso et al. BMC Infect Dis. .

Abstract

Background: In West and Central Africa areas of endemic Loa loa infections overlap with regions of high prevalence of human immunodeficiency virus type 1 (HIV-1) infections. Because individuals in this region are exposed to filarial parasites from birth, most HIV-1 infected individuals invariably also have a history of filarial parasite infection. Since HIV-1 infection both depletes immune system and maintains it in perpetual inflammation, this can hamper Loa loa filarial parasite mediated immune modulation, leading to enhanced loaisis.

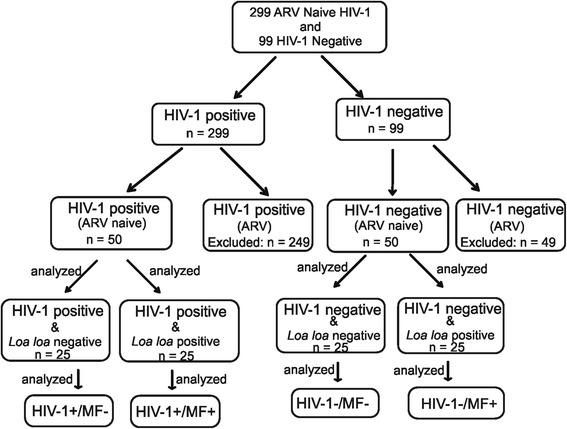
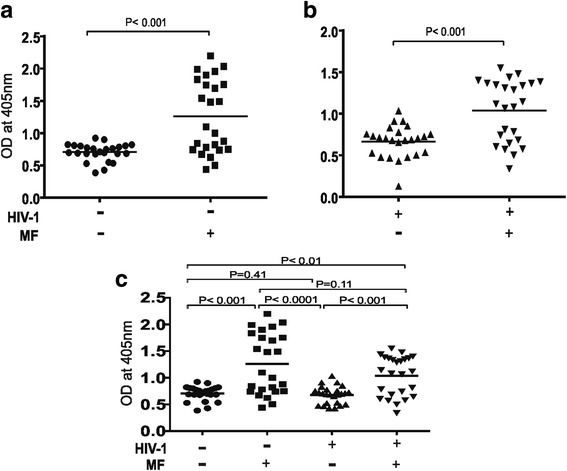
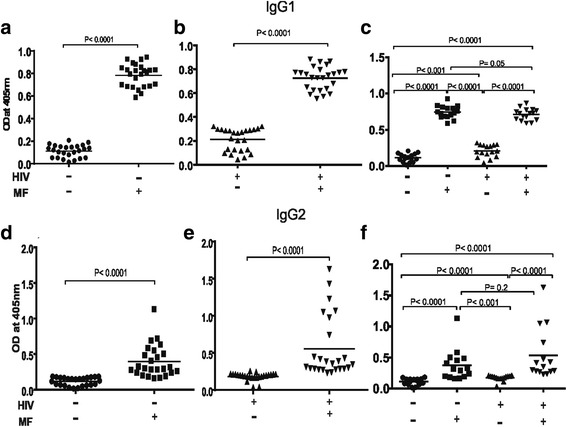
Methods: In this study we have assessed in plasma from asymptomatic anti-retroviral (ARV) naïve Loa loa microfilaraemic HIV-1 infected people the filarial antibody responses specific to a filariasis composite antigen consisting of Wbgp29-BmR1-BmM14-WbSXP. The antibody responses specific to the filariasis composite antigen was determined by enzyme linked immunosorbent assay (ELISA) in plasma from ARV naïve Loa loa microfilaraemic HIV-1 infected participants. In addition the filarial antigen specific IgG antibody subclass profiles were also determined for both HIV-1 positive and negative people.

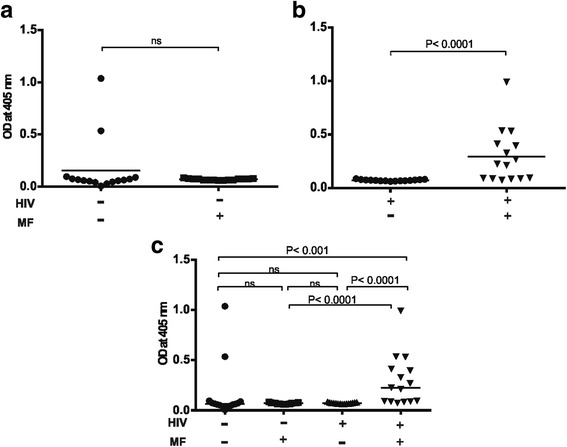
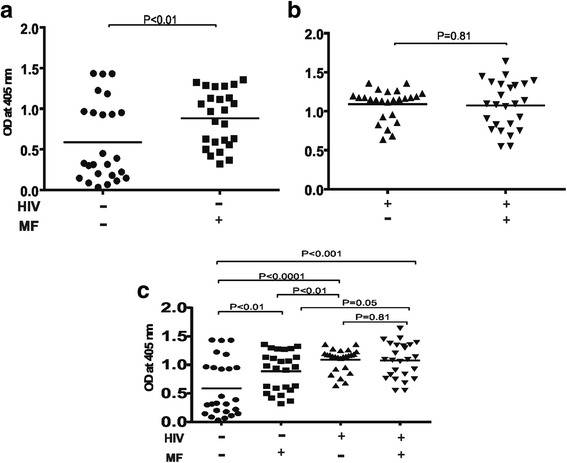
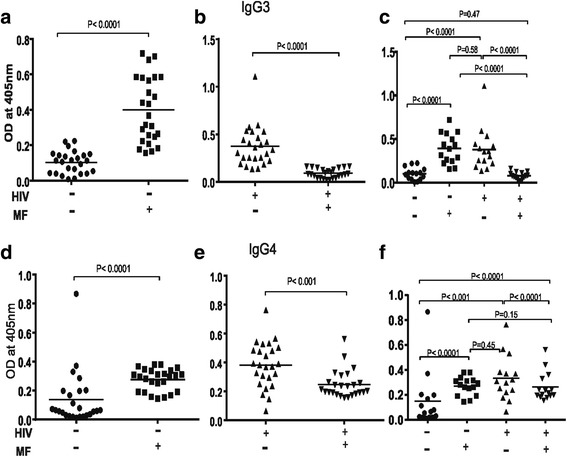
Results: Both Loa loa microfilaraemic HIV-1 positive and negative individuals showed significantly higher plasma levels of IgG1 (P < 0.0001), IgG2 (P < 0.0001) and IgM (P < 0.0001) relative to amicrofilaraemic participants. A significant increase in IgE (P < 0.0001) was observed exclusively in Loa loa microfilaraemic HIV-1 infected people. In contrast there was a significant reduction in the level of IgG4 (p < 0.0001) and IgG3 (P < 0.0001) in Loa loa microfilaraemic HIV-1 infected individuals.

Conclusions: Loa loa microfilaraemia in ARV naïve HIV-1 infected people through differential reduction of plasma levels of filarial antigen specific IgG3, IgG4 and a significant increase in plasma levels of filarial antigen specific IgE could diminish Loa loa mediated immune-regulation. This in effect can result to increase loaisis mediated immunopathology in antiretroviral naive HIV-1 infected people.

Keywords: African eye worm; HIV-1; Loa loa; Loaisis; Microfilaraemia.


Conflict of interest statement

Ethics approval and consent to participate

All human samples in the AFRODEC Cohort were collected with written informed consent under clinical protocols approved by the Republic of Cameroon National Ethics Committee (protocol number 2014/10/499/CE/CNERSH/SP) the CIRCB institutional review board (protocol number 14-11) and the Cameroon government administrative authorization (authorization number 631-1112). The AFRODEC cohort consists of adult HIV-1 infected participants aged 21 to 65 years who were naïve to antiretroviral therapy.

Consent for publication

Not applicable.

Competing interests

The authors declare that they have no competing interests.

Publisher’s Note

Springer Nature remains neutral with regard to jurisdictional claims in published maps and institutional affiliations.

Figures

Fig. 1
Fig. 1
Study flow displaying screening and recruitment of study participants. Members of the CIRCB AFRODEC cohort which are either HIV-1 positive or negative were included based on the presence or absence of Loa loa microfilaraemia during a period of 4 years. Recruited microfilaraemic participants are those showed at least two microfilaraemia per year during the period of the study
Fig. 2
Fig. 2
Plasma levels of Filariasis composite antigen specific IgM in Loa loa microfilaraemia positive and negative ARV naïve HIV-1 infected people compared to seronegative people. As shown in (a) & (b) loa loa microfilaraemia results in significantly (P < 0.001) higher plasma levels of IgM in both HIV-1 negative and positive individuals (compare HIV/MF+ with HIV+/MF+). In (c) a comparative statistically analysis is made between the four groups with respect to plasma levels of their Filariasis composite antigen specific IgM. In (c) a slight but insignificant reduction (P < 0.115) is observed in plasma levels of antigen specific IgM in Loa loa microfilaraemic ARV naïve HIV infected people. Statistical analysis was done with prism graph path 6.0, unpaired t test, Mann-Whitney-U tests and Kruskal-Wallis test
Fig. 3
Fig. 3
Plasma levels of Filariasis composite antigen specific IgE in Loa loa microfilaraemia positive and negative ARV naïve HIV-1 infected people compared to seronegative people. As shown in (a) & (b) Loa loa microfilaraemia results in significantly (P < 0.001) higher plasma levels of antigen specific IgE exclusively in ARV naïve HIV-1 infection (compare HIV/MF+ with HIV+/MF+). In (c) a comparative statistically analysis is made between the four groups with respect to plasma levels of their Filariasis composite antigen specific IgE. In (c) a significantly higher (P < 0.0001) plasma levels of antigen specific IgE is observed exclusively in Loa loa microfilaraemic ARV naïve HIV infected people. Statistical analysis was done with prism graph path 6.0, unpaired t test, Mann-Whitney-U test and Kruskal-Wallis test
Fig. 4
Fig. 4
Plasma levels of Filariasis composite antigen specific IgG in Loa loa microfilaraemia positive and negative ARV naïve HIV-1 infected people compared to seronegative people. As shown in (a) & (b) Loa loa microfilaraemia results in significantly (P < 0.001) higher plasma levels of antigen specific IgG exclusively in HIV-1 negative individuals (compare HIV-/MF- with HIV-/MF+). In (c) a comparative statistically analysis is made between the four groups with respect to plasma levels of their Filariasis composite antigen specific IgG. Statistical analysis was done with prism graph path 6.0, unpaired t test Mann-Whitney-U tests and Kruskal-Wallis test
Fig. 5
Fig. 5
Plasma levels of Filariasis composite antigen specific IgG1 and IgG2 in Loa loa microfilaraemia positive and negative ARV naïve HIV-1 infected people compared to seronegative people. As shown in (a, b&c) Loa loa microfilaraemia results to significantly (P < 0.001) higher plasma levels of antigen specific IgG1 in both HIV-1 negative and positive individuals (compare HIV-/MF- with HIV-/MF+). Similarly in (D, E &F) Loa loa microfilaraemia results to significantly (P < 0.001) higher plasma levels of antigen specific IgG2 in both HIV-1 negative and positive individuals (compare HIV/MF with HIV/MF+). Statistical analysis was done with prism graph path 6.0, unpaired t test, Mann-Whitney-U tests and KruskalKruskal-Wallis test
Fig. 6
Fig. 6
Plasma levels of Filariasis composite antigen specific IgG3 and IgG4 in Loa loa microfilaraemia positive and negative ARV naïve HIV-1 infected people compared to seronegative people. As shown in (a) Loa loa microfilaraemia results to significantly (P < 0.0001) elevated plasma levels of antigen specific IgG3 in HIV-1 negative people on the one hand and a significant reduction (P < 0.0001) of antigen specific IgG3 in HIV-1 positive individuals on the other hand. Similarly in (e) Loa loa microfilaraemia results to significantly (P < 0.0001) higher plasma levels of antigen specific IgG4 in HIV-1 negative individuals in contrast to a significant reduction (P < 0.001) in HIV-1 positive individuals (compare HIV-/MF- with HIV-/MF+). Here the effect of Loa loa microfilaraemic HIV-1 infection was a significant reduction in plasma levels of filariasis composite antigen specific IgG3 (P < 0.0001) and IgG4 (P < 0.001). Statistical analysis was done with prism graph path 6.0, unpaired t test, Mann-Whitney-U tests and Kruskal-Wallis test

Similar articles

Cited by

References

    1. Drame PM, Meng Z, Bennuru S, Herrick JA, Veenstra TD, Nutman TB. Identification and validation of Loa loa microfilaria-specific biomarkers: a rational design approach using proteomics and novel immunoassays. MBio. 2016;7(1):e02132–e02115. doi: 10.1128/mBio.02132-15. - DOI - PMC - PubMed
    1. Zoure HG, Wanji S, Noma M, Amazigo UV, Diggle PJ, Tekle AH, et al. The geographic distribution of Loa loa in Africa: results of large-scale implementation of the rapid assessment procedure for Loiasis (RAPLOA) PLoS Negl Trop Dis. 2011;5(6):e1210. doi: 10.1371/journal.pntd.0001210. - DOI - PMC - PubMed
    1. Cho HY, Lee YJ, Shin SY, Song HO, Ahn MH, Ryu JS. Subconjuctival Loa loa with Calabar swelling. J Korean Med Sci. 2008;23(4):731–733. doi: 10.3346/jkms.2008.23.4.731. - DOI - PMC - PubMed
    1. Metzger WG, Mordmuller B. Loa loa-does it deserve to be neglected? Lancet Infect Dis. 2014;14(4):353–357. doi: 10.1016/S1473-3099(13)70263-9. - DOI - PubMed
    1. Pion SD, Filipe JA, Kamgno J, Gardon J, Basanez MG, Boussinesq M. Microfilarial distribution of Loa loa in the human host: population dynamics and epidemiological implications. Parasitology. 2006;133(Pt 1):101–109. doi: 10.1017/S0031182006000035. - DOI - PubMed

Publication types

MeSH terms