. 2018 May 31;8(6):1921-1932.
doi: 10.1534/g3.118.200284.

Subtle Perturbations of the Maize Methylome Reveal Genes and Transposons Silenced by Chromomethylase or RNA-Directed DNA Methylation Pathways

Affiliations

Subtle Perturbations of the Maize Methylome Reveal Genes and Transposons Silenced by Chromomethylase or RNA-Directed DNA Methylation Pathways

Sarah N Anderson et al. G3 (Bethesda). .

Abstract

DNA methylation is a chromatin modification that can provide epigenetic regulation of gene and transposon expression. Plants utilize several pathways to establish and maintain DNA methylation in specific sequence contexts. The chromomethylase (CMT) genes maintain CHG (where H = A, C or T) methylation. The RNA-directed DNA methylation (RdDM) pathway is important for CHH methylation. Transcriptome analysis was performed in a collection of Zea mays lines carrying mutant alleles for CMT or RdDM-associated genes. While the majority of the transcriptome was not affected, we identified sets of genes and transposon families sensitive to context-specific decreases in DNA methylation in mutant lines. Many of the genes that are up-regulated in CMT mutant lines have high levels of CHG methylation, while genes that are differentially expressed in RdDM mutants are enriched for having nearby mCHH islands, implicating context-specific DNA methylation in the regulation of expression for a small number of genes. Many genes regulated by CMTs exhibit natural variation for DNA methylation and transcript abundance in a panel of diverse inbred lines. Transposon families with differential expression in the mutant genotypes show few defining features, though several families up-regulated in RdDM mutants show enriched expression in endosperm tissue, highlighting the potential importance for this pathway during reproduction. Taken together, our findings suggest that while the number of genes and transposon families whose expression is reproducibly affected by mild perturbations in context-specific methylation is small, there are distinct patterns for loci impacted by RdDM and CMT mutants.

Keywords: DNA methylation; RNA directed DNA methylation; chromomethylase; maize; transposable elements.


Figures

Figure 1
Figure 1
Summary of differentially expressed genes in mild methylation mutants. A-B: A principal component analysis (PCA) was performed using log2(RPM+1) expression values for genes that are DE in at least one mutant line relative to the appropriate control. (A) The full set of samples used for this study was assessed and we found that samples in other genetic backgrounds (mop3-1 and WT Mop3) or tissues (mop1-1 ear and Mop1-B73 ear) have the highest level of variation. All genotypes are homozygous (mutant or wild-type) for the gene of interest. (B) A second PCA was performed using only samples in the B73 genetic background assessed in leaf tissue. WT samples are denoted with triangles and mutants with circles. C-D: The number of up- (red) and down-regulated (blue) genes (C) and TEs (D) is shown for each mutant relative to the appropriate wild-type control. The percent of DE genes or TE families that are up-regulated is marked above each bar, and the number of genes or TEs with consistent changes in two or more mutants from the same pathway is labeled. E-F: Each of the genes (E) or TE families (F) that are DE in at least two CMT or RdDM mutants was used to perform hierarchical clustering using the Euclidean method and the log2 of the fold-change relative to wild-type is visualized with a heat map.
Figure 2
Figure 2
Methylation profiles of DE genes. A. The meta-profile of DNA methylation levels in wild-type B73 seedling leaf tissue was assessed for different sets of DE genes. The DNA methylation levels surrounding the TSS and TTS were plotted for all expressed genes and genes DE in CMT (blue) and RdDM (orange) mutants. The three panels show the levels of CG, CHG, and CHH methylation, with the y-axis showing DNA methylation levels. Error bars represent standard error. B-C Histogram of the average methylation level in the first 400 bp downstream of the TSS for genes up-regulated in CMT mutants in the CG (B) and CHG (C) contexts, showing a bimodal distribution of methylation values. D. Wild-type methylation levels in the CG and CHG contexts are correlated. zmet2-m1 mutant methylation data are shown for those genes with high (>50%) CHG methylation in wild-type (orange dots), showing a loss of CHG but not CG methylation in the mutant. E. Histogram of the difference between mutant and WT methylation in the CG (red) and CHG (blue) contexts for those genes up-regulated in CMT mutants that have WT CHG methylation >50%. F. IGV view of two up-regulated genes in CMT mutants: Zm00001d045627 and Zm00001d021982, which have high CG and CHG methylation in WT and reduced CHG methylation near the TSS (yellow box) in zmet2-m1 mutants. G. The proportion of genes within 2 kb of mCHH islands (mCHH) is shown for different sets of genes. The black bar shows the proportion of all genes with a mCHH island while the other bars show the proportion of genes with altered expression in specific mutant backgrounds that have mCHH islands, and * denotes significantly higher proportion than expected relative to all genes (p-value < 0.01, chi squared test).
Figure 3
Figure 3
Natural variation for methylation level. A. DMRs in diverse genotypes located within 200 bp of the TSS for all genes and for genes with differential expression in either CMT or RdDM mutants. Significant enrichment compared with expressed set is denoted with * (p-value < 0.01, chi squared test). B-C. Examples of genes up-regulated in CMT that have negatively correlated expression and CHG methylation at the bin overlapping the TSS. Data points show values for B73 (red), zmet2-m1 mutants (blue), and 9 diverse genotypes (B97, CML322, HP301, IL14, Mo17, Oh43, P39, Tx303, and W22, black).
Figure 4
Figure 4
Attributes of TE families with altered expression in methylation mutants. A. TE super family membership for TE families genome-wide and with varied expression in mutants, where RST = SINE, RIT = LINE, RIL = LINE-L1-like, DTX = TIR-unclassified, DTT = TIR-Tc1/Mariner, DTH = TIR-PIF/Harbinger, DTC = CACTA, RLX = LTR-unclassified, RLG = LTR-Gypsy, RLC = LTR-Copia, DTM = TIR-Mu, and DTA = TIR-hAT. B. Size distribution for TE families genome-wide and with varied expression in mutants, where small: 2-9 members, medium: 10-99 members, and large: >= 100 members. C. Boxplot of the average LTR similarity per-family for LTR TE families genome-wide, along with those LTR families with differential expression in methylation mutants. D. Boxplot of the average GC content per-family for TE families genome-wide and with expression changes in the mutant. * denotes significant deviation from the mean for all TE families (p-value < 0.01, t-test).
Figure 5
Figure 5
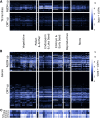
Developmental expression of TE families (A) and genes (B) up-regulated in RdDM and CMT mutants, along with the typical expression of genes mutated in this study (C), where rows show TE families or genes and columns show RNA-seq libraries. Developmental samples are grouped by tissue type, with seed samples split into two clusters based on relative contribution of endosperm: endosperm & late seed (12+ days after pollination) and embryo & early seed (up to 10 days after pollination). For full list of tissue assignments and RNA-seq library accession numbers, see Table S1. Approximately one third of TE families up-regulated in RdDM mutants have higher expression in endosperm than other tissues across development, a pattern not observed for genes. In contrast, many more TE families and genes up-regulated in CMT mutants are never or lowly expressed during typical development.
Figure 6
Figure 6
TE families up-regulated in methylation mutants can have expression of a single element or multiple elements. A-B show two LTR families up-regulated in RdDM mutants, and C-D show two LTR families up-regulated in CMT mutants. All families have both unique (red) and multi-mapped (blue) reads. The proportion of unique-mapping reads assigned to each element is shown for a representative library. Unique-mapping reads showed confident expression of only a single member of a family (A and C) or coordinated expression of more than one member of a family (B and D).

References

    1. Alleman M., Sidorenko L., McGinnis K., Seshadri V., Dorweiler J. E., et al. , 2006. An RNA-dependent RNA polymerase is required for paramutation in maize. Nature 442(7100): 295–298. 10.1038/nature04884 - DOI - PubMed
    1. Anders S., Pyl P. T., Huber W., 2015. HTSeq–a Python framework to work with high-throughput sequencing data. Bioinformatics 31(2): 166–169. 10.1093/bioinformatics/btu638 - DOI - PMC - PubMed
    1. Barber W. T., Zhang W., Win H., Varala K. K., Dorweiler J. E., et al. , 2012. Repeat associated small RNAs vary among parents and following hybridization in maize. Proc. Natl. Acad. Sci. USA 109(26): 10444–10449. 10.1073/pnas.1202073109 - DOI - PMC - PubMed
    1. Bewick A. J., Niederhuth C. E., Ji L., Rohr N. A., Griffin P. T., et al. , 2017. The evolution of CHROMOMETHYLASES and gene body DNA methylation in plants. Genome Biol. 18(1): 65 10.1186/s13059-017-1195-1 - DOI - PMC - PubMed
    1. Bouyer D., Kramdi A., Kassam M., Heese M., Schnittger A., et al. , 2017. DNA methylation dynamics during early plant life. Genome Biol. 18(1): 179 10.1186/s13059-017-1313-0 - DOI - PMC - PubMed

Publication types