. 2018 May 24;131(21):2367-2378.
doi: 10.1182/blood-2017-09-809004. Epub 2018 Apr 4.

NADPH oxidase activation regulates apoptotic neutrophil clearance by murine macrophages

Affiliations

NADPH oxidase activation regulates apoptotic neutrophil clearance by murine macrophages

Juhi Bagaitkar et al. Blood. .

Abstract

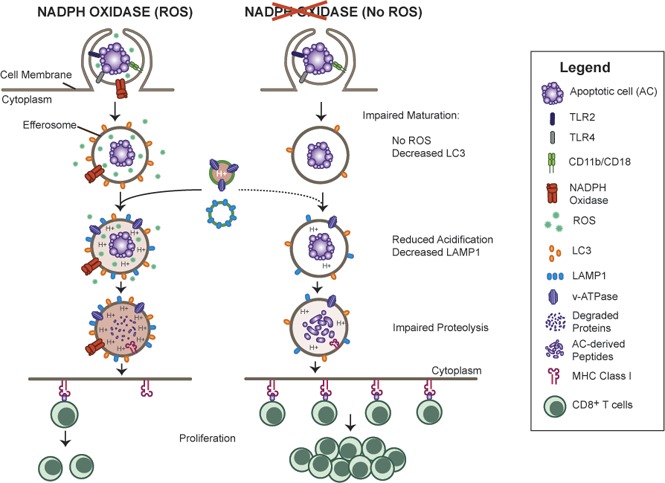
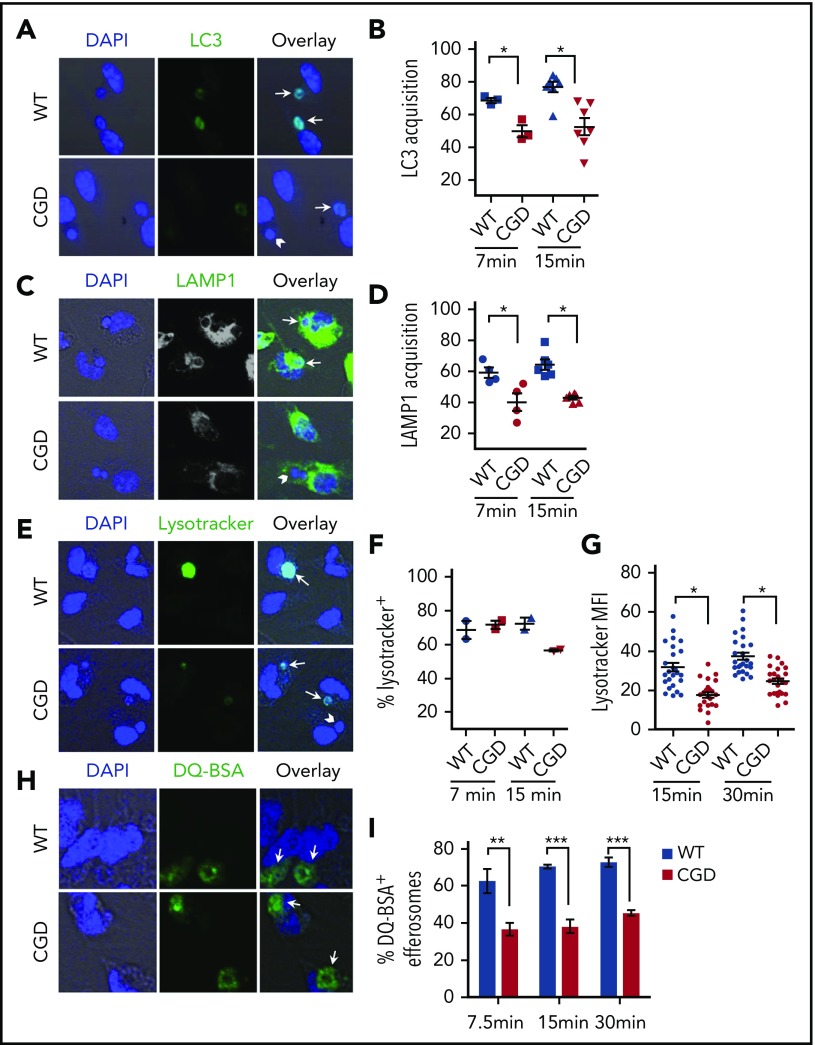
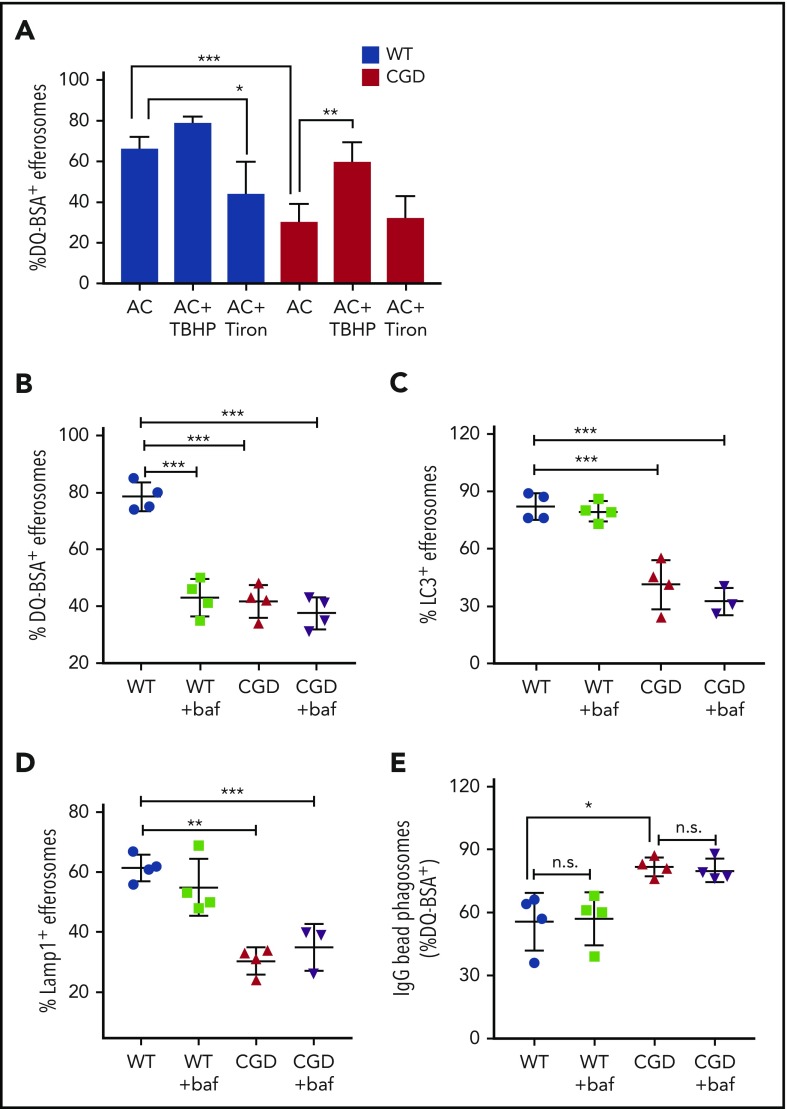
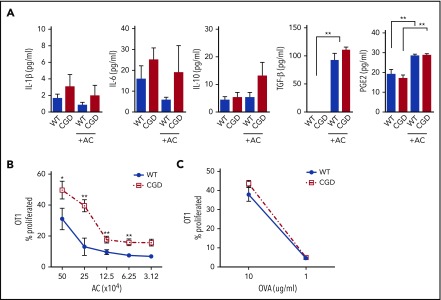
The phagocyte reduced NAD phosphate (NADPH) oxidase generates superoxide, the precursor to reactive oxygen species (ROS) that has both antimicrobial and immunoregulatory functions. Inactivating mutations in NADPH oxidase alleles cause chronic granulomatous disease (CGD), characterized by enhanced susceptibility to life-threatening microbial infections and inflammatory disorders; hypomorphic NADPH oxidase alleles are associated with autoimmunity. Impaired apoptotic cell (AC) clearance is implicated as an important contributing factor in chronic inflammation and autoimmunity, but the role of NADPH oxidase-derived ROS in this process is incompletely understood. Here, we demonstrate that phagocytosis of AC (efferocytosis) potently activated NADPH oxidase in mouse peritoneal exudate macrophages (PEMs). ROS generation was dependent on macrophage CD11b, Toll-like receptor 2 (TLR2), TLR4, and myeloid differentiation primary response 88 (MyD88), and was also regulated by phosphatidylinositol 3-phosphate binding to the p40 phox oxidase subunit. Maturation of efferosomes containing apoptotic neutrophils was significantly delayed in CGD PEMs, including acidification and acquisition of proteolytic activity, and was associated with slower digestion of apoptotic neutrophil proteins. Treatment of wild-type macrophages with the vacuolar-type H+ ATPase inhibitor bafilomycin also delayed proteolysis within efferosomes, showing that luminal acidification was essential for efficient digestion of efferosome proteins. Finally, cross-presentation of AC-associated antigens by CGD PEMs to CD8 T cells was increased. These studies unravel a key role for the NADPH oxidase in the disposal of ACs by inflammatory macrophages. The oxidants generated promote efferosome maturation and acidification that facilitate the degradation of ingested ACs.


Conflict of interest statement

Conflict-of-interest disclosure: The authors declare no competing financial interests.

Figures

None
Graphical abstract
Figure 1.
Figure 1.
Efferocytosis leads to NADPH oxidase activation and oxidant production in mouse peritoneal macrophages. (A) WT and CGD PEMs plated on chamber slides were fed hANs at 1:5 (PEMs to hANs) in the presence of NBT for 30 minutes. Black arrows point to efferosomes. NBT oxidation by ROS leads to purple formazan deposits, observed in WT PEM efferosomes, whereas formazan-negative cytoplasmic inclusions can be observed in CGD PEMs. Images were acquired using 100× oil lens. (B) hANs were labeled with Cell Tracker Red (denoted with a white asterisk) from an X-CGD patient were fed to WT mouse PEMs for 20 minutes. gp91phox recruitment (green ring; white arrow) and 4′,6-diamidino-2-phenylindole (DAPI) nuclear staining (blue) was assessed by confocal microscopy. Images were acquired in a confocal microscope using 100× oil lens. Images from left to right denote confocal images taken at different planes (top to bottom). (C) PEMs from WT and CGD mice were stimulated with hANs, serum-opsonized zymosan (SOZ), and ROS production monitored using lucigenin-elicited chemiluminescence. Response kinetics are shown in panel C as mean ± SD from 1 of 5 experiments. Total integrated relative light units per second (RLU) over 1 hour from duplicate wells of WT or CGD PEMs after stimulation with hANs, apoptotic Jurkat cells, or SOZ from 3 independent experiments are shown for (D) total ROS and (E) intracellular ROS. (F) Total and (G) intracellular ROS production in WT and p40phoxR58A/R58A PEMs after addition of hANs. Statistical differences between groups were calculated using 2-way analysis of variance (ANOVA) with Bonferroni posttest correction. *P < .05; ϕP < .01.
Figure 2.
Figure 2.
Activation of NADPH oxidase during efferocytosis in a CD11b-MyD88–dependent manner. PEMs from WT, CD11b−/−, and CD44−/− mice were either stimulated with (A) hANs or (B) zymosan, and ROS production measured as lucigenin-elicited chemiluminescence. (C) WT PEMs were stimulated with hANs or hANs opsonized with pooled human serum and ROS detected using lucigenin. (D) PEMs from WT and Myd88−/− mice were stimulated with hANs. For each graph, total integrated responses measured as relative light units/s (RLU) recorded over 1 hour are shown. Data from 1 of 3 experiments (duplicate wells) are shown as mean ± SD. Statistical differences between groups were calculated using 2-way ANOVA with Bonferroni posttest correction. *P < .05; ϕP < .01.
Figure 3.
Figure 3.
NADPH oxidase activation promotes digestion of neutrophil MPO within efferosomes. WT and CGD PEMs were pulse-fed hANs for 30 minutes, uningested hANs removed, and degradation of MPO determined in compared 6 hours by DAB histochemistry. (A) WT and CGD PEMss ingested similar numbers of hANs (30 minutes). Six hours postingestion CGD PEMs had significantly higher numbers of MPO+ macrophages compared with WT. (B) Averaged data from 2 to 4 experiments are shown. To compare relative digestion of ingested hANs, we determined the relative intensity of MPO staining in WT and CGD PEMs. Images were acquired using a 100× oil lens. Intensity of MPO staining was scored as “+++” (solid black arrows/strongly positive), “++” (dotted black arrows/intermediate intensity), or “+” (arrowheads/weakly positive) for each MPO+ efferosome at 6 hours and the percentage of distribution shown for each genotype. Results from 1 of 3 independent experiments are shown as mean ± SD. For panels A-C, at least 200 PEMs were scored for each genotype, per time point, and statistical differences between groups calculated using 2-way ANOVA with Bonferroni posttest correction. *P < .05; **P < .01; ϕP < .001. (C) PEMs were incubated with hANs for 30 minutes and chased for 6 or 24 hours. Lysates at the end of each time point were analyzed by western blot for MPO along with β-actin (loading control). Representative data from 1 of 5 independent experiments are shown. (D) Relative MPO band intensities normalized to β-actin were determined by ImageJ from samples from 3 independent experiments. Statistical differences between each time point calculated using the Student t test. ϕP < .001.
Figure 4.
Figure 4.
NADPH oxidase deficiency is associated with delayed maturation of efferosomes. hANs were incubated with WT or CGD PEMs for 7, 15, or 30 minutes as indicated, and efferosome maturation assessed using confocal microscopy–based assays. Images were acquired in a confocal microscope using a 40× oil lens. Representative confocal images shown were taken at 7 minutes, with marker-positive efferosomes indicated by arrows and marker-negative indicated by arrowheads. The percentage of efferosomes positive for the specified markers were analyzed for each genotype (WT = blue; CGD = red) and shown in the panels to the right of each confocal image. (A-B) LC3 acquisition or (C-D) Lamp1 acquisition at 7.5 and 15 minutes. (E-G) Lysotracker Green was added to PEMs for 5 minutes prior to the indicated time points to compare relative acidification of efferosomes. Panel F shows relative fraction of Lysotracker-positive efferosomes in WT and CGD PEMs. (G) MFI in individual Lysotracker-positive WT and CGD efferosomes PEMs 15 and 30 minutes post hANs feeding in 1 representative experiment. MFI was determined using ImageJ. (H-I) To compare proteolysis rates, hANs were coated with DQ-BSA and subsequently fed to PEMs. (I) The fraction of brightly green fluorescent efferosomes in WT and CGD at 7.5, 15, and 30 minutes postfeeding, indicating cleavage of DQ-BSA and unquenching of the BOPIDY dye, whose fluorescence is insensitive to pH over a wide range. Cumulatively, 20 to 50 efferosomes in each of >3 experiments were analyzed for each time point studied for each treatment condition for WT and CGD. Statistical differences between genotypes were measured for each time point using the Student t test (mean ± SD). *P < .05; **P < .01; ***P < .001.
Figure 5.
Figure 5.
Oxidants produced during efferocytosis and efferosome acidification regulate efferosome maturation and proteolysis. (A) WT (black bars) and CGD (white bars) PEMs were preincubated (30 minutes) either with 100 μM TBHP (TB) or 1 mM Tiron. PEMs were then fed DQ-BSA–coated hANs for 15 minutes and the percentage of efferosomes showing DQ-BSA cleavage determined. PEMs were also pretreated with bafilomycin A1 for 30 minutes before feeding with hANs or DQ-BSA–coated hANs for 10 minutes and the fraction of efferosomes exhibiting (B) DQ-BSA-cleavage, (C) LC3 localization, and (D) Lamp1 recruitment was determined. Results from 4 independent experiments are shown as means ± SD. *P < .05; **P < .01, ***P < .001 by the Student t test. (E) Polystyrene beads coated with IgG and DQ-BSA were fed to PEMs at a ratio of 20:1 for 10 minutes. Some PEMs pretreated with 1 μM bafilomycin for 30 minutes before and during the addition of beads, as indicated. After imaging with confocal microscopy, the percentage of efferosomes containing cleaved DQ-BSA was calculated. Results from 4 experiments were shown. *P < .05 by Student t test.
Figure 6.
Figure 6.
CGD macrophages have increased cross-presentation of AC-derived antigens. (A) WT and CGD PEMs were plated in Permanox chamber slides, cultured overnight, and the next day stimulated with hANs for an additional 18 hours. Cell-free supernatants were analyzed by 32-cytokine multiplex cytokine arrays or enzyme linked immunosorbent assays (transforming growth factor β [TGF-β] and prostaglandin E2 [PGE-2]). Data from 1 of 2 experiments using 3 mice per genotype are shown as mean ± SD. Statistical differences were determined by 1-way ANOVA with the Tukey postcorrection test. **P < .01. (B-C) WT and CGD PEMs were incubated for 72 hours with either varying numbers of OVA-loaded ATs or soluble OVA in the presence of CFSE-labeled CD8 T cells derived from transgenic OT1 mice. At the end of 72 hours, proliferation of CD8 OT1 T cells was measured by flow cytometry as CFSE dilution, and the percentage of proliferated T cells determined for each stimulation condition and agonist concentration. Data (mean ± SD) from 1 of 3 representative experiments are shown. **P < .01 using the Student t test.

Similar articles

Cited by

References

    1. Holmdahl R, Sareila O, Olsson LM, Bäckdahl L, Wing K. Ncf1 polymorphism reveals oxidative regulation of autoimmune chronic inflammation. Immunol Rev. 2016;269(1):228-247. - PubMed
    1. Lam GY, Huang J, Brumell JH. The many roles of NOX2 NADPH oxidase-derived ROS in immunity. Semin Immunopathol. 2010;32(4):415-430. - PubMed
    1. Dinauer M, Newburger P, Borregaard N. The phagocyte system and disorders of granulopoiesis and granulocyte function. In: Nathan DG, Orkin SH, eds. Nathan and Oski’s hematology of infancy and childhood. Philadelphia, PA: Elsevier/Saunders; 2014.
    1. Cunninghame Graham DS, Morris DL, Bhangale TR, et al. . Association of NCF2, IKZF1, IRF8, IFIH1, and TYK2 with systemic lupus erythematosus. PLoS Genet. 2011;7(10):e1002341. - PMC - PubMed
    1. Jacob CO, Eisenstein M, Dinauer MC, et al. . Lupus-associated causal mutation in neutrophil cytosolic factor 2 (NCF2) brings unique insights to the structure and function of NADPH oxidase. Proc Natl Acad Sci USA. 2012;109(2):E59-E67. - PMC - PubMed

Publication types