. 2018 May;28(5):726-738.
doi: 10.1101/gr.227975.117. Epub 2018 Apr 4.

Optical mapping reveals a higher level of genomic architecture of chained fusions in cancer

Affiliations

Optical mapping reveals a higher level of genomic architecture of chained fusions in cancer

Eva K F Chan et al. Genome Res. 2018 May.

Abstract

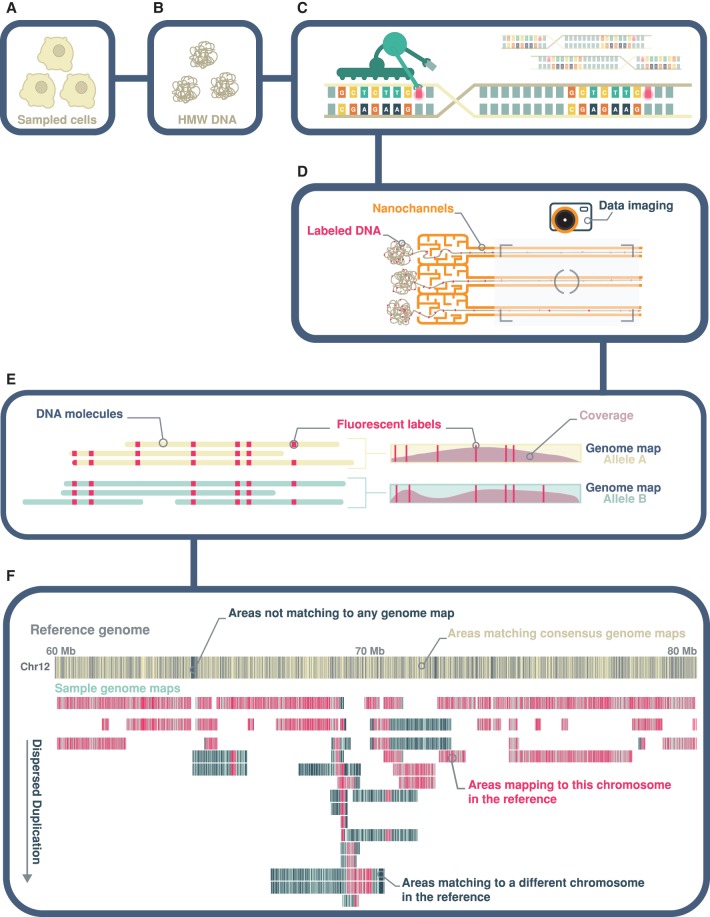
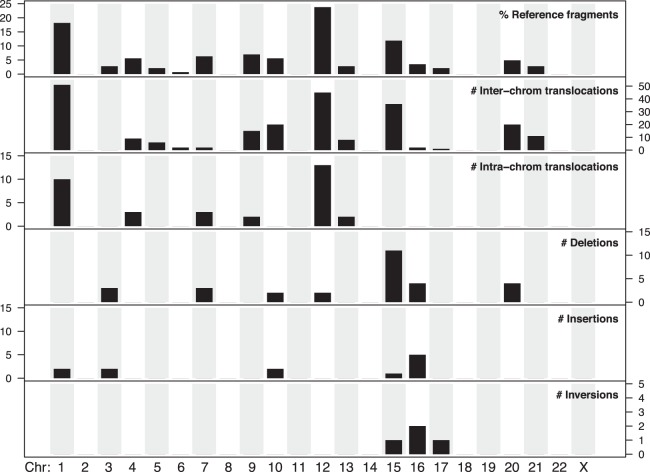
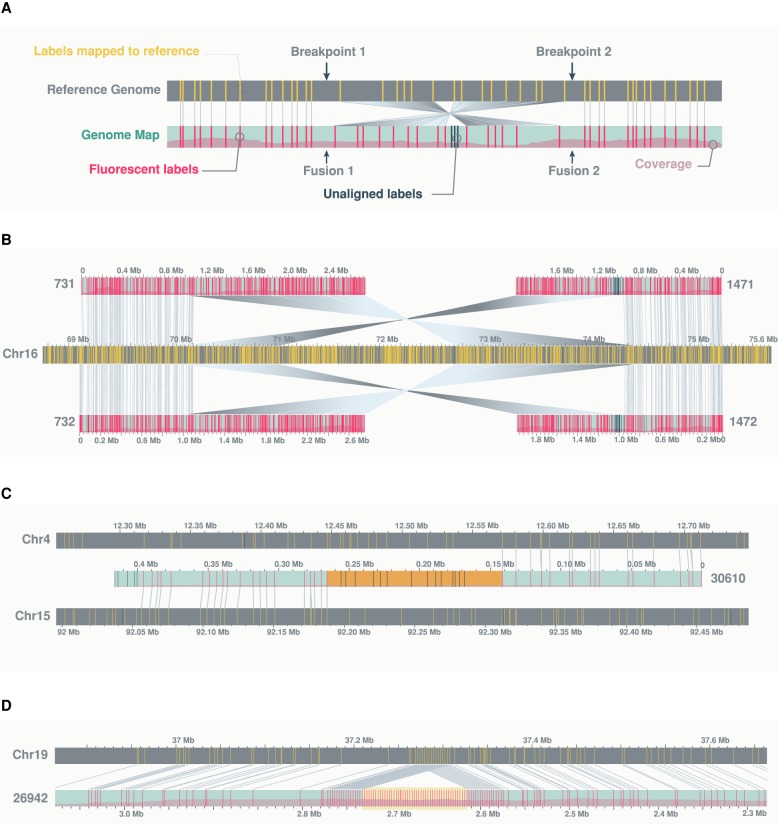
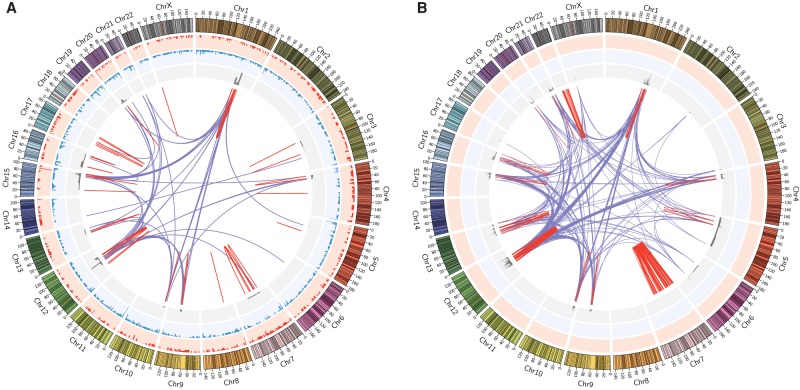
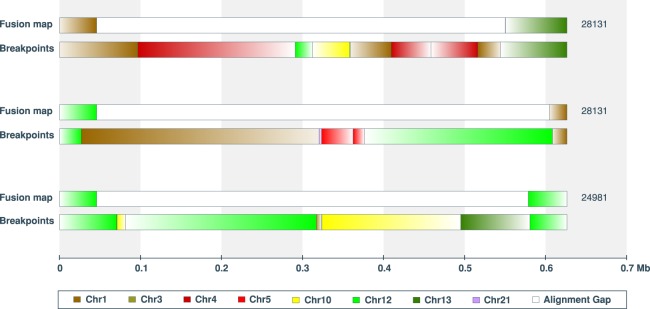
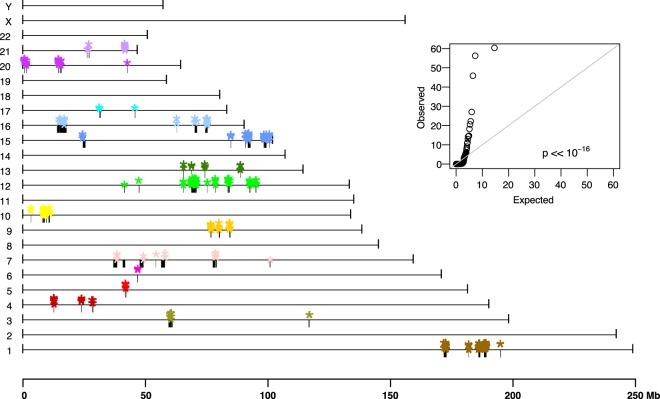
Genomic rearrangements are common in cancer, with demonstrated links to disease progression and treatment response. These rearrangements can be complex, resulting in fusions of multiple chromosomal fragments and generation of derivative chromosomes. Although methods exist for detecting individual fusions, they are generally unable to reconstruct complex chained events. To overcome these limitations, we adopted a new optical mapping approach, allowing megabase-length genome maps to be reconstructed and rearranged genomes to be visualized without loss of integrity. Whole-genome mapping (Bionano Genomics) of a well-studied highly rearranged liposarcoma cell line resulted in 3338 assembled consensus genome maps, including 72 fusion maps. These fusion maps represent 112.3 Mb of highly rearranged genomic regions, illuminating the complex architecture of chained fusions, including content, order, orientation, and size. Spanning the junction of 147 chromosomal translocations, we found a total of 28 Mb of interspersed sequences that could not be aligned to the reference genome. Traversing these interspersed sequences using short-read sequencing breakpoint calls, we were able to identify and place 399 sequencing fragments within the optical mapping gaps, thus illustrating the complementary nature of optical mapping and short-read sequencing. We demonstrate that optical mapping provides a powerful new approach for capturing a higher level of complex genomic architecture, creating a scaffold for renewed interpretation of sequencing data of particular relevance to human cancer.


Figures

Figure 1.
Figure 1.
Whole-genome optical mapping. (A,B) Genome mapping begins with the extraction of intact, high molecular weight (HMW) double-stranded DNA. (C) An endonuclease (Nt.BspQI) that cleaves only one strand of a double-stranded DNA is used to incorporate a fluorescent dye at recognition motifs (GCTCTTCN↓) at a density of 8–11 labels per 100 kb. The DNA backbone is also stained with a second fluorescent dye, YOYO-1. (D) Labeled molecules are linearized, flowed into nanochannels, and imaged using the Bionano Irys instrument. (E) Imaged molecules are digitized and bioinformatically assembled into consensus genome maps and haplotype-phased as appropriate. (F) SVs relative to a reference genome are deduced based on differences in size and/or label patterns. Highly rearranged genome maps will align piecewise to multiple reference genomic regions. Conversely, heavily rearranged regions of the reference genome will show alignments from multiple genome maps (dispersed duplication). In this study, the reference genome map is an in silico digest of the human reference, GRCh38. In this figure, sample consensus genome maps are represented as teal-colored horizontal bars, overlaid with coverage density plots in mauve, whereas GRCh38 Chr 12 is shown as a gray horizontal bar. Fluorescent labels of the Nt.BspQI motif are shown as yellow and pink vertical lines overlaid on the reference and sample genome maps, respectively. Labels on the reference not aligned to any consensus genome map and labels on sample genome maps not aligned to the displayed reference chromosome(s) are shown in dark blue.
Figure 2.
Figure 2.
Consensus genome map overview. An overview is shown of the 3338 consensus genome maps (teal), from cell line 778, aligned to the human reference genome, GRCh38. Overlapping alignments to GRCh38 (i.e., alignment density) is reflected in the color gradient of the genome maps. The reference genome is represented by its cytogenetic G banding (UCSC Table cytoBandIdeo, last updated June 11, 2014), in which dark to light gray in this figure correspond to Giemsa stain intensity, centromeric (acen) bands are represented in red, variable heterochromatic region (gvar) in pink, and stalks (tightly constricted regions) in blue. The breadth of coverage is theoretically limited to 90% of the reference genome due to uninformative regions, including acen, gvar, and stalks.
Figure 3.
Figure 3.
Structural variations identified using whole-genome optical mapping. (A,C) Comparison of large SVs identified in liposarcoma cell line 778 with eight other cancer cell lines reported in Dixon et al. (2017). All SVs from both studies were determined using the Bionano Irys optical mapping system. A shows the typical 1.5- to 2.7-fold more insertions relative to deletions with cell line 778 highlighted with an asterisk (*), whereas C shows cell line 778 harbors much more intra- and inter-chromosomal translocations relative to other cancer cell lines. (B) Box plot showing a statistically significant difference between deletion and insertion sizes, for SVs >1 kb. Thick black horizontal lines in the middle of the box plots correspond to median values, whereas shaded gray boxes encompass the interquartile ranges. (D) The proportions of large insertions and deletions found in cell line 778 are correlated with chromosome length.
Figure 4.
Figure 4.
Fusion map examples. (AC) Schematics of three fusion haplomap pairs containing complex genomic rearrangements. Genome map sizes are indicated on the horizontal axis, in megabase units. In each panel, fragments aligning to GRCh38 chromosomes are indicated by the default UCSC chromosome color scheme (color key in A). Uncolored (white) intervals correspond to regions not aligned to the reference. Alignment orientation to GRCh38 is indicated by color to white gradient corresponding to 5′ to 3′ alignment to the positive strand. Deletions and insertions are indicated by red downward triangles and blue upward triangles, respectively. The two most frequently represented reference fragments (Chr 1: 188,188,529–189,139,998 and Chr 12: 68,713,897–69,940,974) found in the fusion maps are shown with diagonal stripes and indicated as Chr 1: 189 Mb and Chr 12: 69 Mb. Previously identified fusions from sequencing data are numbered per Supplemental Table S1 (cf. Garsed et al. 2014) and indicated above the genome maps. (D) The molecules are aligning to, and making up, consensus genome map #31661, which contains an inverted chained fusion as shown in C. Here, the 2-Mb consensus genome map is represented by a teal horizontal bar following the convention in Figure 1. Individual molecules are represented as “dots on a string,” where each yellow horizontal line represents a molecule, and pink dots represent fluorescent labels. AC are a subset of the 72 fusion maps shown in Supplemental Figure S3.
Figure 5.
Figure 5.
Chromosomal distribution of donor sequences and five SV types observed in 72 fusion maps. Top panel shows the percentage of reference donor fragments found in the fusion maps belonging to each of the 22 autosomes and Chromosome X. The next five panels show the numbers of each SV event involving the corresponding chromosomes.
Figure 6.
Figure 6.
Examples of structural variants. (A) A schematic showing a genomic inversion as characterized by two breakpoints in the reference genome and two fusion junctions in the rearranged genome. (B) An example of a fully resolved 4-Mb inversion, characterized by two pairs of optical maps, each carrying one fusion junction with flanking fragments aligning in opposing directions to one side of the two reference breakpoints. (C) An example of a translocation between Chromosomes 4 and 15, showing “complex” label patterns at the rearrangement junction (highlighted in orange). (D) An example of a 159-kb insertion, showing “repeat” label patterns of the inserted fragment (highlighted in yellow). In this case, the repeat corresponds to the SST1 satellite. Additional examples highlighting complex label patterns at translocation junctions relative to repetitive label patterns of insertions can be found in Supplemental Figure S7. The schema in this figure follows the same convention as outlined in Figure 1. Matching labels between sample and reference genome maps are connected by gray lines. For clarity, any additional genome maps aligning to the reference regions of interest are hidden from view.
Figure 7.
Figure 7.
Circos plots of genomic variations in cell line 778. (A) Circos plot derived from whole-genome mapping of the cell line. (B) Circos plot derived from short-read sequencing of two neochromosome isoforms, using data from Garsed et al. (2014). For both plots, moving inward from the outer ideogram are histograms of deletions (>1 kb; red) and insertions (>1 kb; blue) in the background genome. For the neochromosome Circos plot (B), these two tracks are only placeholders, as the background genomes were not sequenced in the original study. The next track, in gray, shows copy number profiles of the fusion maps (A) and neochromosomes (B). Linked lines in the middle of the Circos plots show complex genomic rearrangements: red for intra-chromosomal and purple for inter-chromosomal translocations. Plots were generated using the Circos visualization tool (Krzywinski et al. 2009).
Figure 8.
Figure 8.
Traversal of optical mapping fusions using short-read sequencing breakpoint calls. Complex rearrangements of many small genomic fragments result in gaps in the fusion maps, because these fragments are too small to be uniquely aligned to the reference genome. Of the 86 optical mapping gaps traversed (348 kb mean gap length), the length of breakpoint traversals differed by 2024 bp on average. Shown are three examples of fusion gaps >0.5 Mb encompassing 6–9 GRIDSS breakpoints.
Figure 9.
Figure 9.
Fusion clusters. Donor fragments (black bars) and complex genomic rearrangement breakpoints (colored stars) found in the 72 fusion maps are highly localized on the reference genome map, GRCh38. Fusion breakpoints on some chromosomes are notably at the boundaries of reference donor fragments (e.g., Chromosomes 15 and 20), suggesting that acquisitions of these fragments in the rearranged genomes were late events. This is in contrast to donor fragments with “internal” CGRs (e.g., Chromosome 12), suggesting their acquisitions were early events. The inset is a quantile–quantile plot of the observed adjacent fusion breakpoint distances relative to the null expectation of random distribution, indicating the distribution of fusion breakpoints is statistically significantly nonrandom. Colors of plotting symbol correspond to the default UCSC chromosome color scheme.

References

    1. The 1000 Genomes Project Consortium. 2015. A global reference for human genetic variation. Nature 526: 68–74. - PMC - PubMed
    1. Andersson A, Moorman AV, Harrison CJ, Mullighan C. 2016. Acute lymphoblastic leukaemia. In The genetic basis of haematological cancers (ed. Tosi S, Reid AG), pp. 223–264. John Wiley, Chichester, UK.
    1. Baca SC, Prandi D, Lawrence MS, Mosquera JM, Romanel A, Drier Y, Park K, Kitabayashi N, MacDonald TY, Ghandi M, et al. 2013. Punctuated evolution of prostate cancer genomes. Cell 153: 666–677. - PMC - PubMed
    1. Bell JM, Lau BT, Greer SU, Wood-Bouwens C, Xia LC, Connolly ID, Gephart MH, Ji HP. 2017. Chromosome-scale mega-haplotypes enable digital karyotyping of cancer aneuploidy. Nucleic Acids Res 45: e162. - PMC - PubMed
    1. Cameron DL, Schröder J, Penington JS, Do H, Molania R, Dobrovic A, Speed TP, Papenfuss AT. 2017. GRIDSS: sensitive and specific genomic rearrangement detection using positional de Bruijn graph assembly. Genome Res 27: 2050–2060. - PMC - PubMed

Publication types