Meta-Analysis
. 2019 Apr;68(4):604-614.
doi: 10.1136/gutjnl-2017-315494. Epub 2018 Apr 4.

Cell-centred meta-analysis reveals baseline predictors of anti-TNFα non-response in biopsy and blood of patients with IBD

Affiliations
Meta-Analysis

Cell-centred meta-analysis reveals baseline predictors of anti-TNFα non-response in biopsy and blood of patients with IBD

Renaud Gaujoux et al. Gut. 2019 Apr.

Abstract

Objective: Although anti-tumour necrosis factor alpha (anti-TNFα) therapies represent a major breakthrough in IBD therapy, their cost-benefit ratio is hampered by an overall 30% non-response rate, adverse side effects and high costs. Thus, finding predictive biomarkers of non-response prior to commencing anti-TNFα therapy is of high value.

Design: We analysed publicly available whole-genome expression profiles of colon biopsies obtained from multiple cohorts of patients with IBD using a combined computational deconvolution-meta-analysis paradigm which allows to estimate immune cell contribution to the measured expression and capture differential regulatory programmes otherwise masked due to variation in cellular composition. Insights from this in silico approach were experimentally validated in biopsies and blood samples of three independent test cohorts.

Results: We found the proportion of plasma cells as a robust pretreatment biomarker of non-response to therapy, which we validated in two independent cohorts of immune-stained colon biopsies, where a plasma cellular score from inflamed biopsies was predictive of non-response with an area under the curve (AUC) of 82%. Meta-analysis of the cell proportion-adjusted gene expression data suggested that an increase in inflammatory macrophages in anti-TNFα non-responding individuals is associated with the upregulation of the triggering receptor expressed on myeloid cells 1 (TREM-1) and chemokine receptor type 2 (CCR2)-chemokine ligand 7 (CCL7) -axes. Blood gene expression analysis of an independent cohort, identified TREM-1 downregulation in non-responders at baseline, which was predictive of response with an AUC of 94%.

Conclusions: Our study proposes two clinically feasible assays, one in biopsy and one in blood, for predicting non-response to anti-TNFα therapy prior to initiation of treatment. Moreover, it suggests that mechanism-driven novel drugs for non-responders should be developed.

Keywords: Ibd; gene expression; infliximab; meta-analysis; tnf-alpha.


Conflict of interest statement

Competing interests: YC declares Abbvie grant support, advisory and lecture fees, Janssen advisory and lecture fees, Takeda grant support and advisory and lecture fees, Pfizer advisory and lecture fees and Protalix Advisory fees. RG and ESt declares CytoReason equity and advisory fees. RG declares equity in CytoReason. SSO-O declares CytoReason equity and advisory fees and Takeda grant support.

Figures

Figure 1
Figure 1
Characteristic sorted cell type expression of gene signatures of anti-TNFα response reported from heterogeneous tissue biopsy show contributions from distinct immune cell subsets. Analysis of the immune contribution of 109 unique signature genes mapped to a compendium of sorted cell expression profiles, spanning 17 immune cell subpopulations as well as colon tissue samples. Shown are the contributions (x-axis), that is, number of genes assigned, for eight major cell lineages (y-axis), highlighted into resting (light shade) and activated/memory (dark shade) subpopulations. Lineages are ordered by decreasing total contribution, with most signature genes are expressed in the myeloid, B and T-cell lineages (68%, 13% and 19% of the genes, respectively). Eighty-five per cent of signature genes are expressed in low abundance in bulk healthy colon.
Figure 2
Figure 2
Meta-analysis of computationally deconvolved cell subset proportions identifies consistently higher proportions of inflammatory macrophages and plasma cells in non-responders. (A) Plasma cell and macrophage log2 proportion fold change between response groups, across three cohorts (P values ≤0.05 by Wilcoxon rank sum are shown in red and grey for significantly higher proportions in non-responders and no significant changes, respectively). (B,C) Cellular signature abundance decreases while differences persist after anti-TNFα treatment. Deconvolution-derived frequencies of inflammatory macrophages (B) and plasma cells (C) pre/post-anti-TNFα treatment (x-axis). TNFα, tumour necrosis factor alpha.
Figure 3
Figure 3
Abundance of plasma cells and macrophage subtypes in biopsies of patients with IBD predicts anti-TNFα treatment outcome. (A) Plasma cells were immunostained with anti-CD138 antibody in an independent set of IBD biopsies. Example staining slides showing visual differences in plasma cells between responders and non-responders patients. CD138+ plasma cells are coloured in brown, showing a clear increased staining in non-responsive patients. (B) ROC curves showing the predictive power of plasma cells (cyan) and inflammatory macrophages (orange) proportions as quantified by a pathologist categorical score (solid line, AUC=71% and AUC=67%, respectively) and a quantitative score for plasma cells (dashed line, AUC=81%). (C) ROC curve analysis of a cohort of 52 patients with IBD collected from two medical centres whose biopsies were stained by CD138+ IHC staining. Plasma cell abundance classifies non-response at baseline (AUC=71% and AUC=74% by the pathologist and quantitative scores, respectively). (D) This predictive power increases when restricting to highly inflamed tissues according to the pathologist score (AUC=82% and AUC=84% by the pathologist and quantitative scores respectively). AUC, area under the curve; CD, Crohn’s disease; IHC, immunohistochemistry; ROC, receiver operating characteristic.
Figure 4
Figure 4
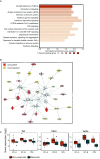
Adjusting samples for cell subset variation unmasks upregulated pathways in biopsies of anti-TNF non-responders. (A) Meta-analysis of non-response associated biological pathways by GSEA on cell subset adjusted expression data supports upregulation of TLR2/4, IL-6 and B cell receptor signalling, as well as other inflammatory pathways. (B) Top enriched IPA network identified from meta-analysis of cell subset adjusted gene expression data. The CCL7-CCR2 axis is upregulated in non-responders (C) Box plots showing the expression of TNFα and its receptors, TNFR1 and TNFR2 in the three biopsy cohorts in the original unadjusted data. CCL7, chemokine ligand 7; CCR2, chemokine receptor 2; GSEA, gene set enrichment analysis; IL-6, interleukin 6; IPA, Ingenuity pathway analysis; TLR, toll-like receptor; TNFα, tumour necrosis factor alpha.
Figure 5
Figure 5
TREM-1 expression in blood predicts anti-TNF non-response at baseline in Crohn’s patients. (A) Box plot showing TREM-1 mRNA expression as measured in whole blood of 22 responding (blue) and non-responding (red) patients with CD, prior to initiation of infliximab therapy. (B) Receiver operating characteristic curve of classifier of anti-TNF response at baseline based on TREM-1 expression in whole blood. CD, Crohn’s disease; mRNA, messenger RNA; TREM-1, triggering receptor expressed on myeloid cells 1.

Comment in

References

    1. Kaplan GG. The global burden of IBD: from 2015 to 2025. Nat Rev Gastroenterol Hepatol 2015;12:720–7. 10.1038/nrgastro.2015.150 - DOI - PubMed
    1. Sartor RB. Mechanisms of disease: pathogenesis of Crohn’s disease and ulcerative colitis. Nat Clin Pract Gastroenterol & Hepatol 2006;3:390–407. - PubMed
    1. Targan SR, Hanauer SB, van Deventer SJ, et al. . A short-term study of chimeric monoclonal antibody cA2 to tumor necrosis factor alpha for Crohn’s disease. Crohn’s Disease cA2 Study Group. N Engl J Med 1997;337:1029–35. 10.1056/NEJM199710093371502 - DOI - PubMed
    1. Ben-Horin S, Kopylov U, Chowers Y. Optimizing anti-TNF treatments in inflammatory bowel disease. Autoimmun Rev 2014;13:24–30. 10.1016/j.autrev.2013.06.002 - DOI - PubMed
    1. Ben-Horin S, Chowers Y. Tailoring anti-TNF therapy in IBD: drug levels and disease activity. Nat Rev Gastroenterol Hepatol 2014;11:243–55. 10.1038/nrgastro.2013.253 - DOI - PubMed

Publication types

MeSH terms