. 2018 Apr 17;115(16):E3759-E3768.
doi: 10.1073/pnas.1719089115. Epub 2018 Apr 4.

FAM210A is a novel determinant of bone and muscle structure and strength

Affiliations

FAM210A is a novel determinant of bone and muscle structure and strength

Ken-Ichiro Tanaka et al. Proc Natl Acad Sci U S A. .

Abstract

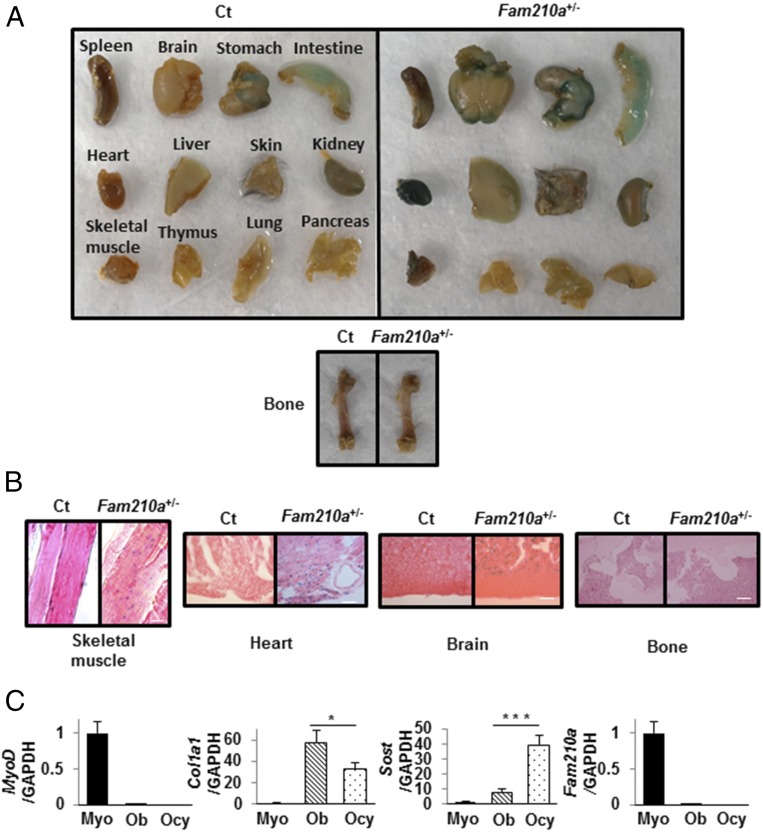
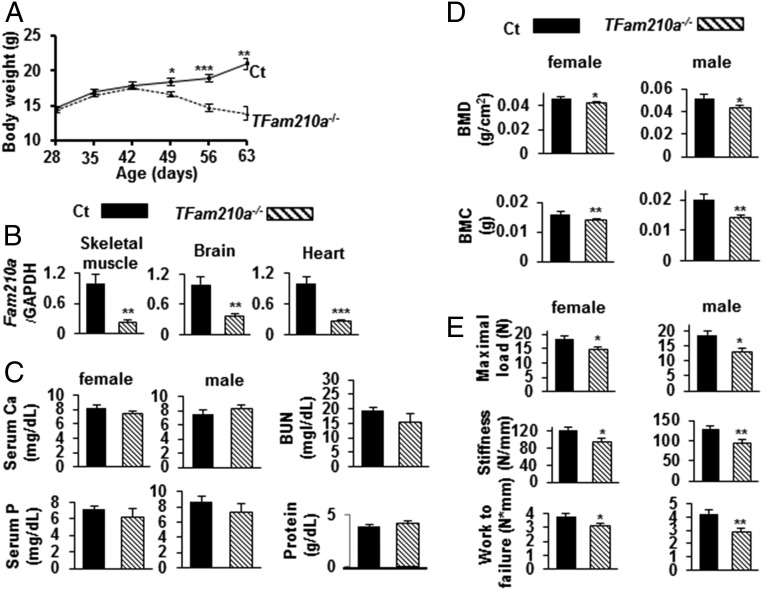
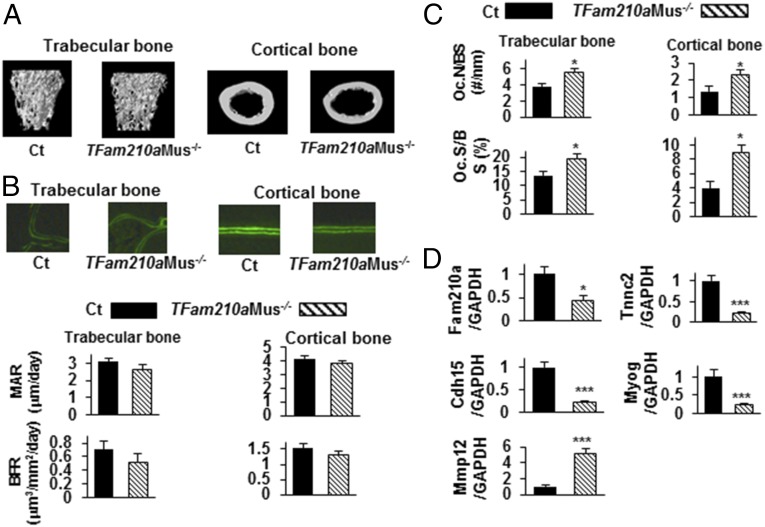
Osteoporosis and sarcopenia are common comorbid diseases, yet their shared mechanisms are largely unknown. We found that genetic variation near FAM210A was associated, through large genome-wide association studies, with fracture, bone mineral density (BMD), and appendicular and whole body lean mass, in humans. In mice, Fam210a was expressed in muscle mitochondria and cytoplasm, as well as in heart and brain, but not in bone. Grip strength and limb lean mass were reduced in tamoxifen-inducible Fam210a homozygous global knockout mice (TFam210a-/- ), and in tamoxifen-inducible Fam210 skeletal muscle cell-specific knockout mice (TFam210aMus-/- ). Decreased BMD, bone biomechanical strength, and bone formation, and elevated osteoclast activity with microarchitectural deterioration of trabecular and cortical bones, were observed in TFam210a-/- mice. BMD of male TFam210aMus-/- mice was also reduced, and osteoclast numbers and surface in TFam210aMus-/- mice increased. Microarray analysis of muscle cells from TFam210aMus-/- mice identified candidate musculoskeletal modulators. FAM210A, a novel gene, therefore has a crucial role in regulating bone structure and function, and may impact osteoporosis through a biological pathway involving muscle as well as through other mechanisms.

Keywords: FAM210A; bone; muscle; osteoporosis; sarcopenia.


Conflict of interest statement

The authors declare no conflict of interest.

Figures

Fig. 1.
Fig. 1.
X-Gal staining in mouse organs and tissues in Ct mice and in Fam210a+/− mice expressing the lacZ reporter under the control of the Fam210a promoter, and quantitative RT-PCR of RNA from primary myoblasts, osteoblasts, and osteocytes of WT mice. (A) X-Gal staining (blue) showing expression of Fam210a in diverse organs in Ct mice (Fam210a WT mice with CMV-Cre) (Left) and in Fam210a+/− mice expressing the lacZ reporter (Right). (B) Microscopy of X-Gal staining in tissues of Ct mice (Left) and Fam210a+/− mice expressing the lacZ reporter (Right). Scale bars represent 50 μm for skeletal muscle, heart, and brain, and 200 μm for bone. No blue staining reaction product was observed in Ct tissues. The highest levels of staining in Fam210a+/− mice were seen in skeletal muscle, heart, and brain; no reaction product was seen in bone. (C) Quantitative RT-PCR to assess the expression of MyoD, Col1a1 (encoding collagen type 1 alpha 1 chain), Sost (encoding sclerostin), and Fam210a in primary myoblasts (Myo), osteoblasts (Ob), and osteocytes (Ocy) from WT mice. Data are expressed relative to the GAPDH mRNA value. Data represent mean ± SEM of 5–6 determinations. *P < 0.05; ***P < 0.001.
Fig. 2.
Fig. 2.
Phenotypic characterization of Fam210a+/− mice. (A) Serum calcium (Ca) and phosphorus (P) in Ct (female, n = 9; male, n = 7) and Fam210a+/− (female, n = 8; male; n = 8) mice, and the level of Fam210a protein in serum and muscle extracts of Ct (n = 5) and Fam210a+/− (n = 5) mice using ELISA. Undetectable levels were less than 0.3 ng/mL. (B) BMD and BMC of Ct (female, n = 9; male, n = 9) and Fam210a+/− (female, n = 10; male, n = 9) mouse bones. (C) Parameters of biomechanical bone strength, i.e., the maximal load, stiffness, and work-to-failure, measured by three-point bending tests, in Ct (female, n = 14; male, n = 11) and Fam210a+/− (female, n = 11; male, n = 12) mouse femurs. (D) Representative 3D reconstructions of μCT images of trabecular and cortical bone in Ct (n = 3) and Fam210a+/− (n = 3) mouse femurs. (E) Representative micrographs of double calcein-labeled sections of trabecular and cortical bone of Ct and Fam210a+/− mice; MAR and BFR in trabecular and cortical bone of Ct (n = 4) and Fam210a+/− (n = 4) mice calculated using calcein double labeling. (F) Oc.N/BS and Oc.S/BS in trabecular and cortical bone of Ct (trabecular bone, n = 8; cortical bone, n = 10) and Fam210a+/− (trabecular bone, n = 8; cortical bone, n = 9) mice using TRAP staining. (G) Grip strength in Ct (female, n = 5; male, n = 5) and Fam210a+/− (female, n = 5; male, n = 5) mice; lean mass of all limbs in Ct (female; n = 4, male; n = 4) and Fam210a+/− (female, n = 5; male, n = 4). Solid bars indicate values in Ct, and hatched bars indicate values in Fam210a+/− mice. Data represent mean ± SEM. *P < 0.05; **P < 0.01; ***P < 0.001 using a two-sided Student’s t test. Analyses were performed at 56 d of age.
Fig. 3.
Fig. 3.
Phenotypic characterization of TFam210a−/− mice. (A) Body weight of TFam210a−/− mice and of CT mice (Fam210aflox/flox littermates) (28 d, n = 6; 35 d, n = 6; 42 d, n = 6; 49 d, n = 6; 56 d, n = 6; 63 d, n = 3) and TFam210a−/− (28 d, n = 8; 35 d, n = 8; 42 d, n = 6; 49 d, n = 6; 56 d, n = 6; 63 d, n = 3) mice, after tamoxifen injection at 28 d after birth for 5 d. (B) Quantitative RT-PCR in mouse muscle, brain, and heart extracts to assess the expression of Fam210a in Ct (n = 5) and TFam210a−/− (n = 5) mice. Data are expressed relative to the GAPDH mRNA value. (C) Serum Ca and P, in Ct (calcium: female, n = 4; male, n = 5; phosphate: female, n = 5; male, n = 5) and TFam210a−/− (calcium: female, n = 5; male, n = 5; phosphate: female, n = 5; male, n = 5) mice. BUN and total protein in Ct and TFam210a−/− (mixture of one female and two male samples, i.e., n = 3 for each parameter in Ct and in TFam210a−/−). (D) BMD and BMC of Ct (female, n = 7; male, n = 8) and TFam210a−/− (female, n = 6; male, n = 9) mouse bones. (E) Biomechanical parameters of bone strength, by three-point bending tests in femurs, including the maximal load, stiffness, and work-to-failure, in Ct (maximal load: female, n = 4; male, n = 8; stiffness: female, n = 4; male, n = 6; work-to-failure: female, n = 5; male; n = 8) and TFam210a−/− (maximal load: female, n = 4; male; n = 8; stiffness: female, n = 4; male, n = 6; work-to-failure: female, n = 8; male; n = 8). Solid bars indicate values in Ct, and hatched bars indicate values in TFam210a−/− mice. Data represent mean ± SEM. *P < 0.05; **P < 0.01; ***P < 0.001 using a two-sided Student’s t test. Analyses were done at 56 d of age.
Fig. 4.
Fig. 4.
Additional phenotypic characterization of TFam210a−/− mice. (A) Representative 3D reconstructions of μCT images of trabecular and cortical bone of Ct (n = 4) and TFam210a−/− (n = 4) mouse femurs. (B) Representative micrographs of double calcein-labeled sections of trabecular and cortical bone of Ct and TFam210a−/− mice; MAR and BFR in trabecular and cortical bone Ct (n = 4) and TFam210a−/− (n = 4) mice calculated using calcein double labeling. (C) Oc.N/BS and Oc.S/BS in trabecular and cortical bone of Ct (Oc.N/BS: trabecular bone, n = 5; cortical bone, n = 5; Oc.S/BS: trabecular bone, n = 5; cortical bone, n = 5) and TFam210a−/− (Oc.N/BS: trabecular bone, n = 4; cortical bone, n = 5; Oc.S/BS: trabecular bone, n = 5; cortical bone; n = 5) mice using TRAP staining. (D) Grip strength in Ct (female; n = 5, male; n = 5) and TFam210a−/−, (female; n = 4, male; n = 4) mice; lean mass of all limbs in Ct (female; n = 5, male; n = 3) and TFam210a−/− (female; n = 4, male; n = 4). Solid bars indicate values in Ct, and hatched bars indicate values in TFam210a−/− mice. Data represent mean ± SEM. *P < 0.05; **P < 0.01; ***P < 0.001 using a two-sided Student’s t test.
Fig. 5.
Fig. 5.
Phenotypic characterization of TFam210aMus−/− mice. (A) Immunofluorescence was performed in primary myoblasts (Left) and myotubes (Right) from CT (Fam210a flox/flox) mice. Representative confocal microscopy images show localization of nuclei (DAPI; blue fluorescence), Fam210a (green fluorescence), and mitochondria (red fluorescence) or both Fam210a and mitochondria (yellow in merge panels). (B) Body weight of CT (Fam210a flox/flox littermates) (28 d; n = 9, 35 d; n = 9, 42 d; n = 9, 49 d; n = 9, 56 d; n = 9, 63 d; n = 9) and TFam210aMus−/− (28 d; n = 8, 35 d; n = 8, 42 d; n = 8, 49 d; n = 8, 56 d; n = 7, 63 d; n = 7) mice, following tamoxifen injection at 28 d after birth for 5 d. (C) Quantitative RT-PCR in mouse muscle to assess the expression of Fam210a in Ct (n = 5) and TFam210aMus−/− (n = 5) mice. Data are expressed relative to the GAPDH mRNA value. (D) Grip strength in Ct (female, n = 6; male, n = 9) and TFam210aMus−/− (female, n = 6; male, n = 5) mice; lean mass of all limbs in Ct (female, n = 5; male, n = 7), and TFam210aMus−/− (female, n = 4; male, n = 4) mice. (E) BMD and BMC of Ct (female, n = 12; male, n = 13) and TFam210aMus−/− (female, n = 13; male, n = 11) mouse bones. (F) Biomechanical parameters of bone strength, by three-point bending tests in femurs including the maximal load, stiffness, and work-to-failure, in Ct (maximal load: female, n = 6; male, n = 6; stiffness: female, n = 5; male; n = 6; work-to-failure: female, n = 6; male, n = 6) and TFam210aMus−/− (maximal load: female, n = 6; male, n = 5; stiffness: female, n = 5; male, n = 5; work-to-failure: female, n = 6; male; n = 5) mice. Data are expressed relative to the GAPDH mRNA value. Data represent mean ± SEM. *P < 0.05; **P < 0.01; ***P < 0.001 using a two-sided Student’s t test.
Fig. 6.
Fig. 6.
Additional phenotypic characterization of TFam210aMus−/− mice. (A) Representative 3D reconstructions of μCT images of trabecular and cortical bone in Ct (n = 4) and TFam210aMus−/− (n = 4) mouse femurs. (B) Representative micrographs of double calcein-labeled sections of trabecular and cortical bone of Ct and TFam210aMus−/− mice; MAR and BFR in trabecular and cortical bone Ct (n = 4) and TFam210aMus−/− (n = 4) mice calculated using double calcein labeling. (C) Oc.N/BS and Oc.S/BS in trabecular and cortical bone of Ct (Oc.N/BS: trabecular bone, n = 5; cortical bone, n = 5; Oc.S/BS: trabecular bone, n = 5; cortical bone, n = 5) and TFam210aMus−/− (Oc.N/BS: trabecular bone, n = 5; cortical bone, n = 5; Oc.S/BS: trabecular bone, n = 5; cortical bone; n = 5) mice using TRAP staining. Solid bars indicate values in Ct, and hatched bars indicate values in TFam210aMus−/− mice. (D) RT-PCR to assess the expression of troponin c2, Tnnc2, Cdh15, Myog, and Mmp12 in primary muscle cells from Ct (n = 4) and TFam210aMus−/− (n = 4) mice. Data are expressed relative to the GAPDH mRNA value. Data represent mean ± SEM. *P < 0.05; **P < 0.01; ***P < 0.001 using a two-sided Student’s t test.

References

    1. Cosman F, et al. National Osteoporosis Foundation Clinician’s guide to prevention and treatment of osteoporosis. Osteoporos Int. 2014;25:2359–2381. - PMC - PubMed
    1. Cauley JA, Thompson DE, Ensrud KC, Scott JC, Black D. Risk of mortality following clinical fractures. Osteoporos Int. 2000;11:556–561. - PubMed
    1. Visser M, Schaap LA. Consequences of sarcopenia. Clin Geriatr Med. 2011;27:387–399. - PubMed
    1. Cooper C, et al. Frailty and sarcopenia: Definitions and outcome parameters. Osteoporos Int. 2012;23:1839–1848. - PubMed
    1. Rockwood K, Stolee P, McDowell I. Factors associated with institutionalization of older people in Canada: Testing a multifactorial definition of frailty. J Am Geriatr Soc. 1996;44:578–582. - PubMed

Publication types

MeSH terms

Grants and funding